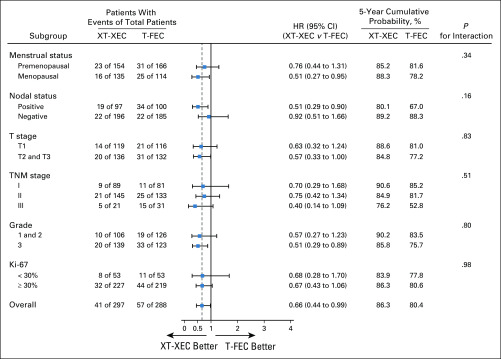
FIG 3.
Results of exploratory subgroup analyses for disease-free survival. A forest plot shows the hazard ratios (HRs) and 95% CIs (horizontal lines) according to menstrual status, tumor size, nodal status, grade, and protein encoded by the MKI67 gene (Ki-67) status. Data are from the log-rank test. Data are presented as number of patients with events of total number of patients. T-FEC, 3 cycles of docetaxel followed by 3 cycles of fluorouracil, epirubicin, and cyclophosphamide; XT-XEC, 3 cycles of capecitabine plus docetaxel followed by 3 cycles of capecitabine, epirubicin, and cyclophosphamide.

