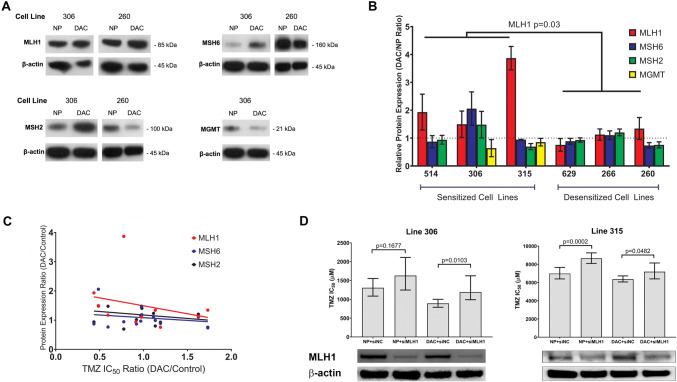
Fig. 2.
Changes in MMR and MGMT protein expression in GBM cell lines after DAC treatment. a Immunoblots of MLH1, MSH2, MSH6 and MGMT in sensitized line 306 and desensitized line 260. b Immunoblot band intensities were quantified and normalized against β-actin. Expression levels in DAC-preconditioned and NP cells from the same line were then compared. The mean DAC/NP ratio ± SEM for each sensitized and desensitized line is shown. The dashed line indicates a DAC/NP ratio of 1 (protein level unchanged by DAC). Average MLH1 DAC/NP ratio is 2.31 compared to 1.12 in sensitized versus desensitized cell lines (two group t test, p = 0.03). c DAC/NP MLH1, MSH2, and MSH6 protein expression ratios wer plotted against the DAC/NP IC50 ratio for all cell lines. For MLH1, r = − 0.62 and p = 0.077, Spearmann’s rank test. d Two cell lines, 306 and 315, exhibiting TMZ sensitization, were unpreconditioned (NP) or preconditioned with DAC (DAC) for 7 days. During the last 2 days of preconditioning, cells were transfected with 10 nM scrambled (siNC) or MLH1-specific (siMLH1) siRNA. TMZ IC50 was then determined using MTS assays and compared using extra sum-of-squares F tests

