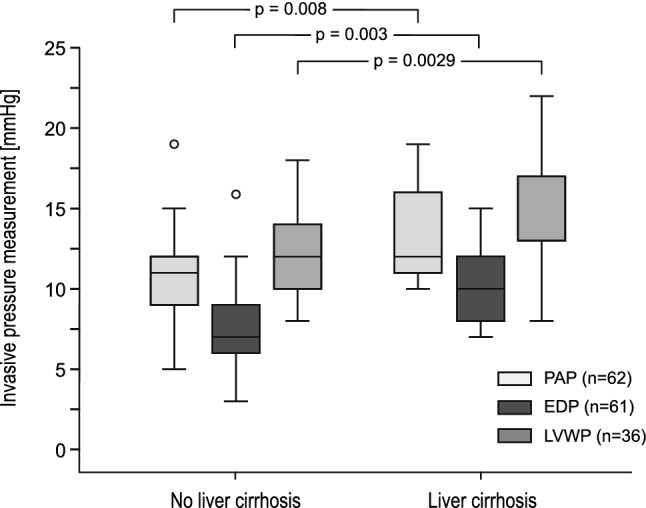
Fig. 2.

Correlation between invasively measured hemodynamic parameters and liver cirrhosis. Data are shown as box plots representing two patient groups: patients with and without liver cirrhosis. The top and the bottom of the rectangle indicate the 75th and 25th percentiles, and the middle horizontal line the median value. The vertical line extends from the maximal to the minimal invasively measured pressure in each group. Light gray box plots display values of pulmonary artery pressure of patients with liver cirrhosis (n = 14) and without liver cirrhosis (n = 48). Gray box plots with dashed black lines represent end-diastolic pressure of patients with liver cirrhosis (n = 14) and patients without (n = 47). Dark gray box plots display liver vein wedge pressure in cirrhotic (n = 9) and non-cirrhotic patients (n = 29). PAP pulmonary artery pressure, EDP end-diastolic pressure, LVWP liver vein wedge pressure
