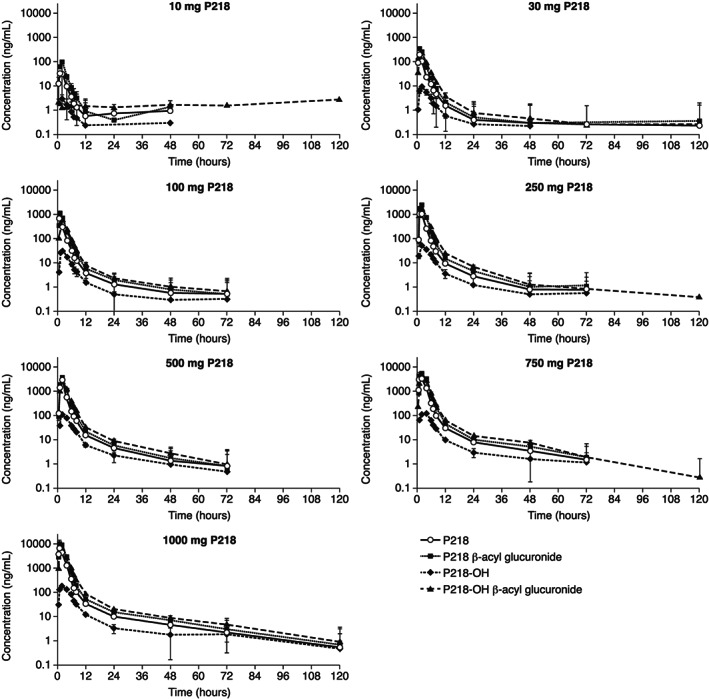
Figure 2.

Geometric mean (±SD) plasma concentration‐time profiles for P218 compared to metabolites following single P218 doses of 10‐1000 mg. Note: Data plotted for P218 and metabolites shown individually for all doses are given in Supporting Information Fig. S1
