
Figure 3.
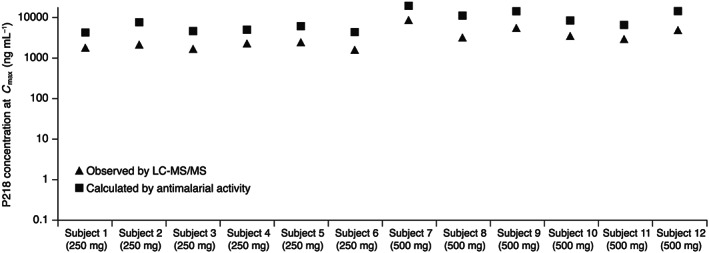
Observed P218 C max using LC‐MS/MS compared to the P218 C max calculated from the ex vivo antimalarial activity of serum samples collected at the same time point. Note: See Supporting Information Fig. S4 for concentration‐time curves
Official websites use .gov
A
.gov website belongs to an official
government organization in the United States.
Secure .gov websites use HTTPS
A lock (
) or https:// means you've safely
connected to the .gov website. Share sensitive
information only on official, secure websites.
Observed P218 C max using LC‐MS/MS compared to the P218 C max calculated from the ex vivo antimalarial activity of serum samples collected at the same time point. Note: See Supporting Information Fig. S4 for concentration‐time curves