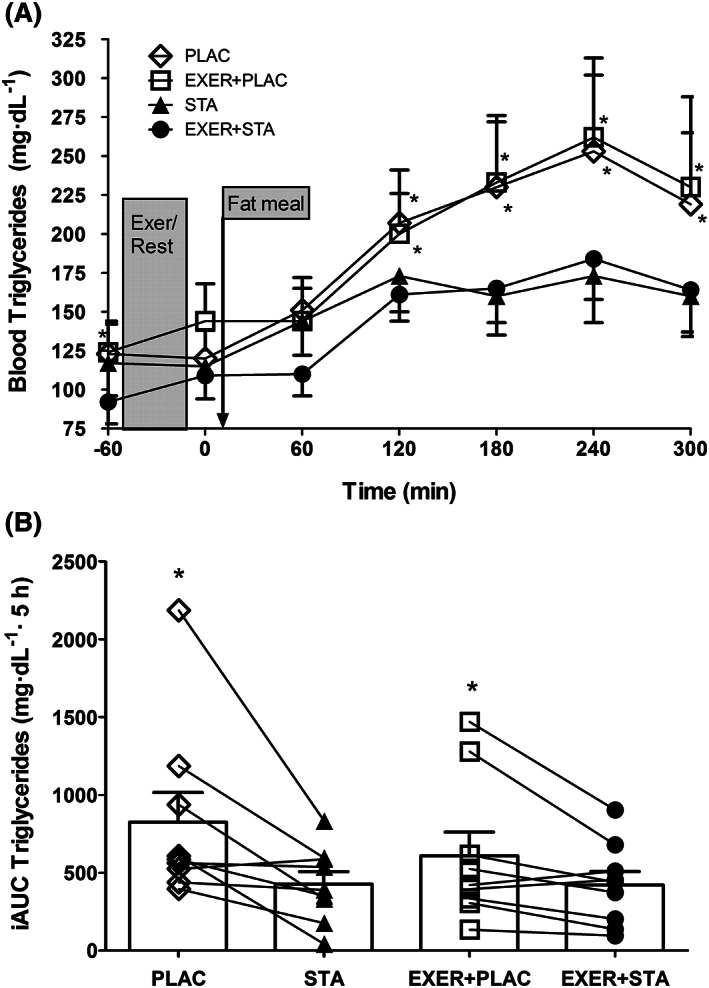
Figure 1.

Postprandial blood triglyceride response to a high fat meal: (A) hourly concentrations and (B) incremental area under the curve (iAUC) for the 4 experimental trials (i.e. with and without exercise and statin). Data are presented as mean ± standard error of the mean for 10 hypercholesteraemic metabolic syndrome individuals. * significantly higher when statin medicine was withdrawn compared to its matched trial with statins (i.e. PLAC vs EXER+PLAC and STA vs EXER+STA; P < .05)
