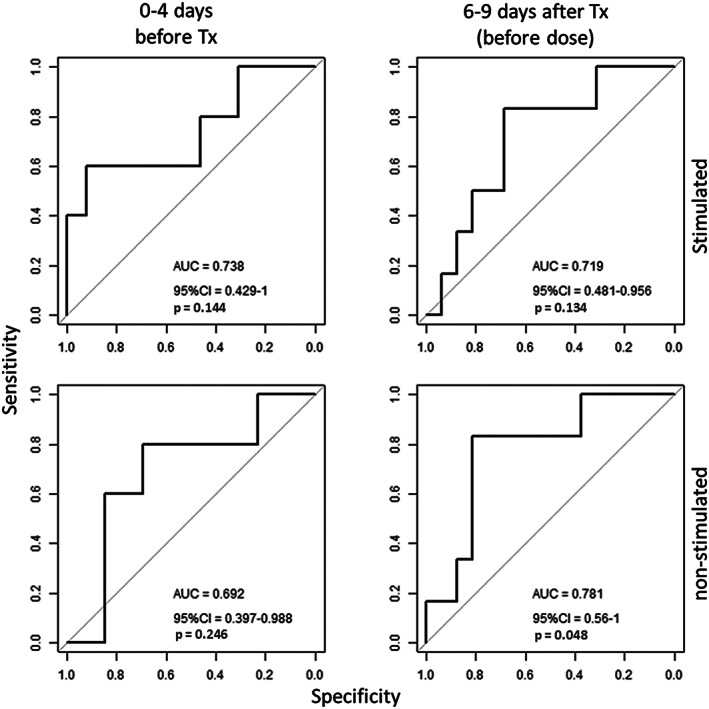
Figure 4.

Receiver operating characteristic curve analysis of inosine monophosphate dehydrogenase capacity measured in mitogen‐stimulated and nonstimulated peripheral blood mononuclear cells (PBMC) collected 0–4 days prior to and 6–9 days (before dosage) after transplantation to predict the need for dose reduction within the first year after transplantation (Tx)
