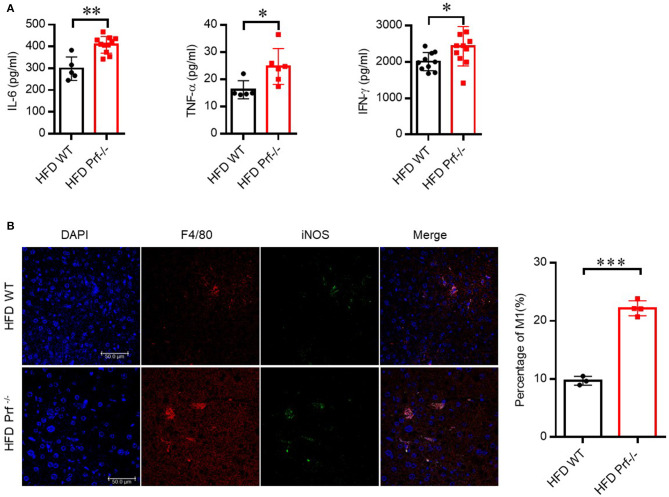
Figure 4.
Perforin deficiency drives the accumulation of M1 macrophages and releases of pro-inflammatory cytokines in the liver with HFD challenge. WT and Prf−/− mice were fed HFD for 10 weeks. (A) IL-6 (left panel, n = 5–11), TNF-α (middle panel, n = 5–6), and IFN-γ (right panel, n = 10–11) levels in liver supernatants. (B) Representative immunofluorescence images from liver with DAPI (blue), F4/80 (red), iNOS (green), and co-localization (merged image) (left) and the percentage of M1/M (refers to iNOS+F4/80+cells/F4/80+ cells) was calculated (right). The data shown in each panel of the figures were collected from a single experiment, and each experiment was repeated for at least three times and rendered consistent results. Means ± SEM, *p < 0.05; **p < 0.01; ***p < 0.001.

