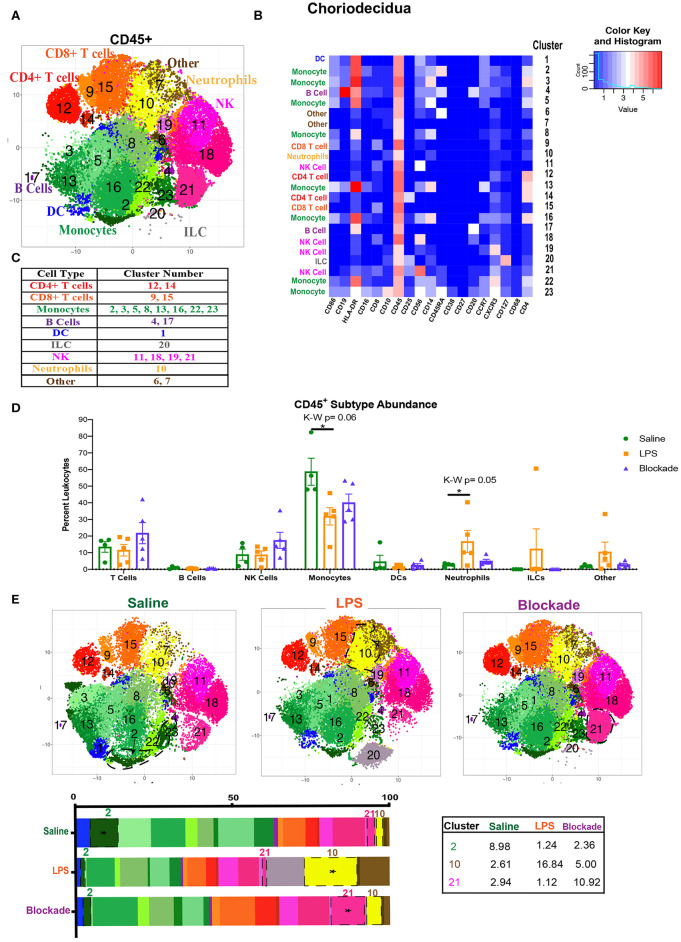
Figure 3.
Global immune landscape of healthy and inflamed choriodecidua. (A) Automated clustering of CD45+ cells isolated from the choriodecidua. tsne is a merged image of all monkeys analyzed saline (n = 4), LPS (n = 5), and blockade (n = 5). (B) Clusters were identified as one of nine major immune subtypes based on intensity of antibody staining represented by the heatmap. (C) Determination of each cluster as a major immune subset. Kruskal–Wallis values are listed at the top of each graph. Post hoc P-values are listed as lines connecting respective comparisons. (D) Abundance of each major immune subtype classified in (C) as a percent of CD45+ cells. (E) tsnes and stacked bar graphs of cluster abundance separated by treatment group. Outlined populations are those that are altered between treatment groups. Mean percentages of these clusters are listed in the adjacent table. Tables *P < 0.05.

