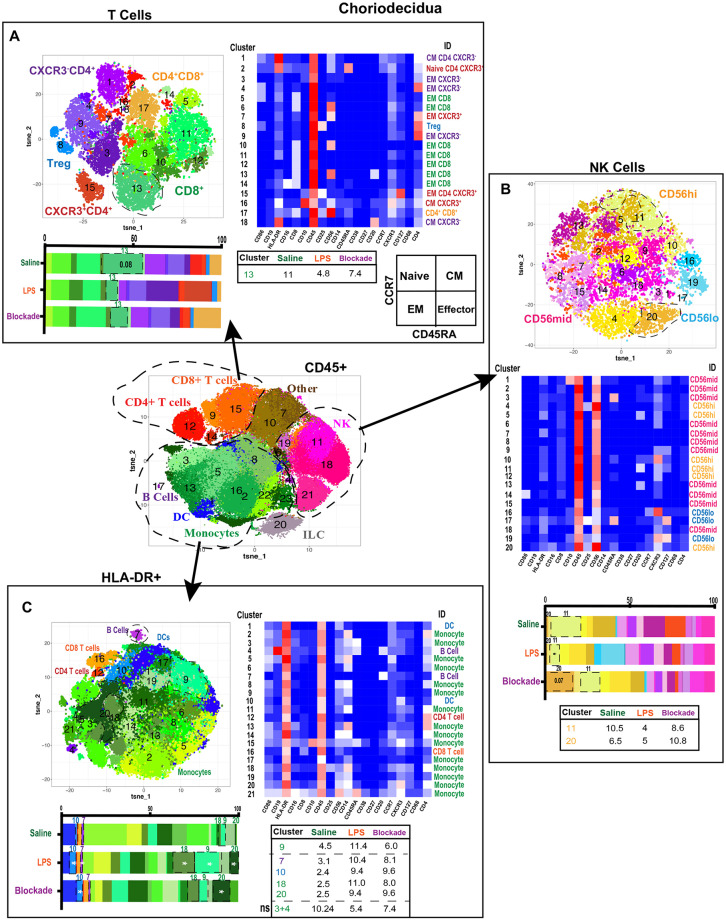
Figure 4.
Greater diversity of choriodecidual immune cells was observed with more specific clustering. (A) Automated clustering of T cells in the choriodecidua, merged tsne of saline (n = 4), LPS (n = 5), and blockade (n = 5). Clusters were identified by relative intensity of each antibody in the heatmap. Clusters that changed with treatment are outlined in black and mean percentage listed in the adjacent tables. Memory state was determined using CCR7 and CD45RA. (B) Automated clustering of NK cells in the choriodecidua, merged tsne of saline (n = 4), LPS (n = 5), and blockade (n = 5). Clusters were identified by relative intensity of each antibody in the heatmap. Clusters that changed with treatment are outlined in black and mean percentages listed in the adjacent tables. (C) Automated clustering of HLA-DR+ cells in the choriodecidua, merged tsne of saline (n = 4), LPS (n = 5), and blockade (n = 5). Clusters were identified by relative intensity of each antibody in the heatmap. Clusters that changed with treatment are outlined in black and mean percentages listed in the adjacent tables. *P < 0.05 on Kruskal–Wallis testing.

