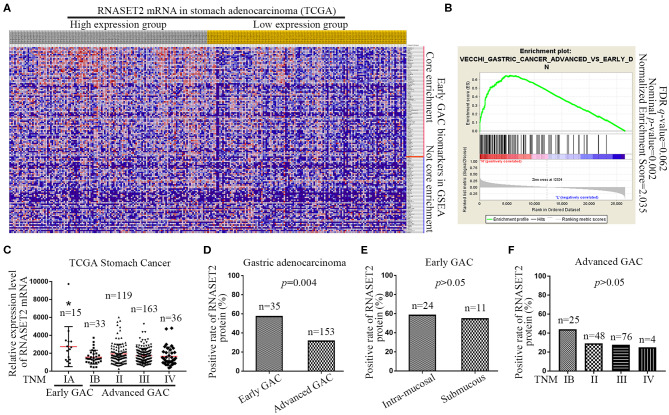
Figure 3.
Expression of RNASET2 in early and advanced GAC tissues. (A) Heat map of GSEA showed that a large number of gene sets (79/134) involved in early GAC were enriched in high RNASET2 mRNA expression group; The largest values were displayed as the reddest and the smallest values were displayed as the bluest. (B) Enrichment plot of “VECCHI_GASTRIC_CANCER_ADVANCED_VS_EARLY_DN” showed that the normalized enrichment score was 2.035. (C) TCGA datasets showed the relative expression level of RNASET2 mRNA in TNM IA, IB, II, III, and IV stage (*p = 0.0014, TNM IA vs. TNM IB, II, III, or IV, ANOVA). (D) Positive rate of RNASET2 protein in early GAC and advanced GAC tissues (p = 0.004, Chi-Square test). (E) Positive rate of RNASET2 protein in intra-mucosal early GAC and submucous early GAC (p > 0.05, Chi-Square test). (F) Positive rate of RNASET2 protein in TNM IB, II, III, and IV stage advanced GAC (p > 0.05, Chi-Square test).

