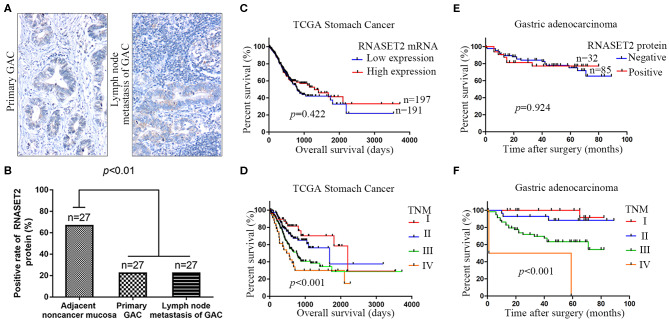
Figure 4.
The relationship between the expression of RNASET2 and lymph nodal metastasis or patient's prognosis. (A) Representative tissue specimens of RNASET2 protein expression in primary GAC (left) and lymph nodal metastasis of GAC (right); DAB staining (brown); nuclear counterstaining (hematoxylin); original magnification, ×100. (B) Positive rate of RNASET2 protein in the primary GAC, lymph nodal metastasis of GAC, and adjacent non-cancerous gastric mucosa tissues (p < 0.01, Chi-Square test). (C) TCGA datasets showed the relationship of RNASET2 mRNA expression to overall survival (p = 0.422): Low expression group, n = 191; High expression group, n = 197. (D) TCGA datasets showed the relationship of TNM stage to overall survival (p < 0.001): TNM I, n = 49; TNM II, n = 119; TNM III, n = 163; TNM IV, n = 36; Log-rank test. (E) Relationship of RNASET2 protein expression to overall survival (p = 0.924): IHC score = 0 or 1 were considered to RNASET2 protein negative expression, n = 85, IHC score = 2 or 3 were considered to RNASET2 protein positive expression, n = 32. (F) Relationship of TNM stage to overall survival (p < 0.001): TNM I, n = 28; TNM II, n = 29; TNM III, n = 58; TNM IV, n = 2.

