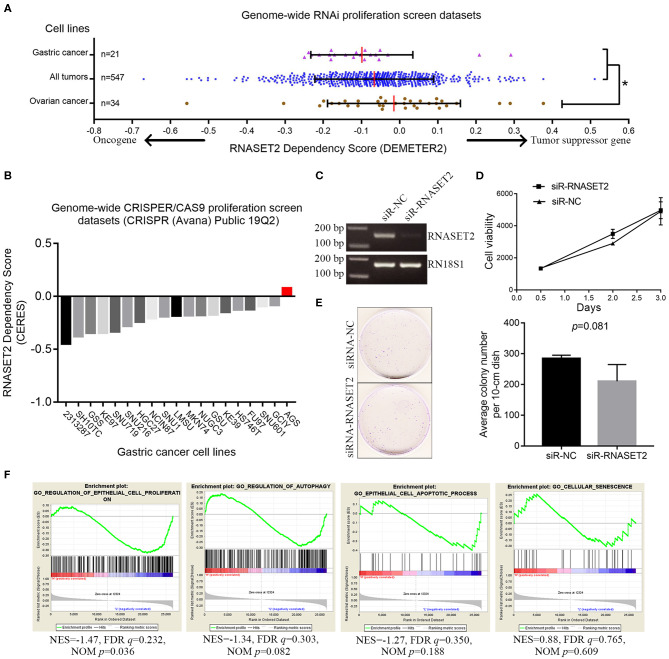
Figure 5.
The relationship between RNASET2 and the cell growth of GAC. (A) The distribution of RNASET2 dependency scores (DEMETER2) in gastric cancer cell lines, ovarian cancer cell lines, and all cancer cell lines group. Red line was the median of the RNASET2 Dependency Scores in the group. *the gene dependency scores in ovarian cancer were significantly higher than that in gastric cancer and all cancer cell line groups (p < 0.05). (B) The CERES dependency score of RNASET2 in 19 GAC cell lines. Red bar was the CERES dependency score of RNASET2 in AGS. A score of 0 indicates a gene is not essential for cell growth; correspondingly −1 is comparable to the median of all pan-essential genes. (C) RNASET2 mRNA expression were detected by the reverse transcription PCR after transient (48 h) siRNA transfection of RNASET2 or negative control (NC). (D) Cell viability was detected by AlamarBlue assay after transient (12, 48, and 72 h) siRNA transfection of RNASET2 or NC, p > 0.05, n = 3. (E) Clonogenicity of AGS cells was detected by colony formation assay after siRNA transfection of RNASET2 or NC for 12 days, p > 0.05, n = 3. (F) GSEA enrichment plots showed that the expression change of RNASET2 mRNA was not enriched in gene sets of “epithelial cell proliferation,” “regulation of autophagy,” “epithelial cell apoptotic process,” and “cellular senescence” (NOM p > 0.01).

