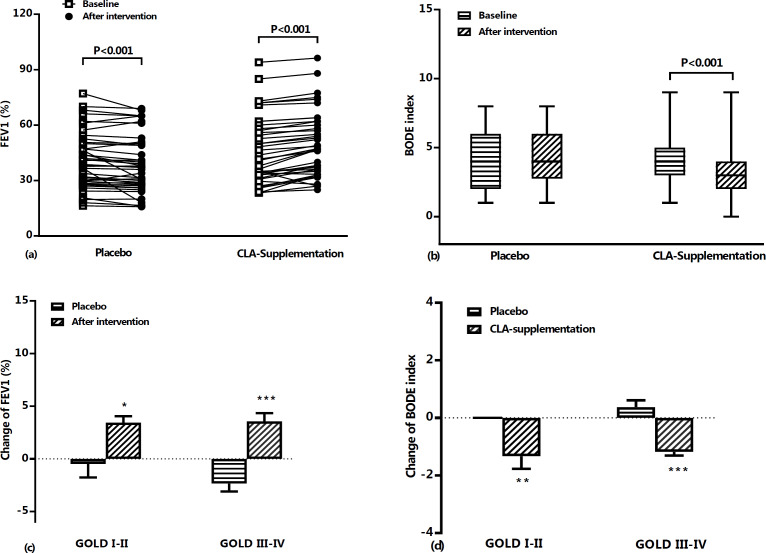
Figure 2.
FEV1% predict (a) and BODE index (b) at baseline and after treatment period in placebo and CLA supplementation groups. Data are shown as individual value (for FEV1%) and mean±SD (or median and 25th–75th percentiles) values of percent changes in FEV1% predict (c) and BODE index (d) based on GOLD criteria in placebo and CLA supplementation groups during the study period. FEV1; forced expiratory volume in 1 second, BODE index; (Body mass index, airflow Obstruction, Dyspnea and Exercise capacity).*: p<0.05, **: p<0.01, and ***: p<0.001

