
Figure 3.
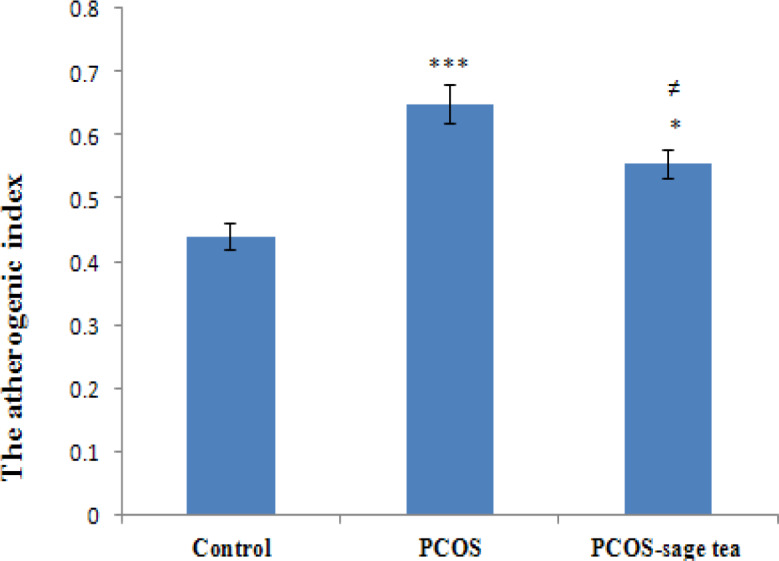
The atherogenic index levels in the control, PCOS, and PCOS-sage tea groups. Data are expressed as mean±SEM (n=6). *p<0.05 vs. control group; ***p<0.001 vs. control group; and ≠p<0.05 vs. PCOS group
Official websites use .gov
A
.gov website belongs to an official
government organization in the United States.
Secure .gov websites use HTTPS
A lock (
) or https:// means you've safely
connected to the .gov website. Share sensitive
information only on official, secure websites.
The atherogenic index levels in the control, PCOS, and PCOS-sage tea groups. Data are expressed as mean±SEM (n=6). *p<0.05 vs. control group; ***p<0.001 vs. control group; and ≠p<0.05 vs. PCOS group