Figure 4.

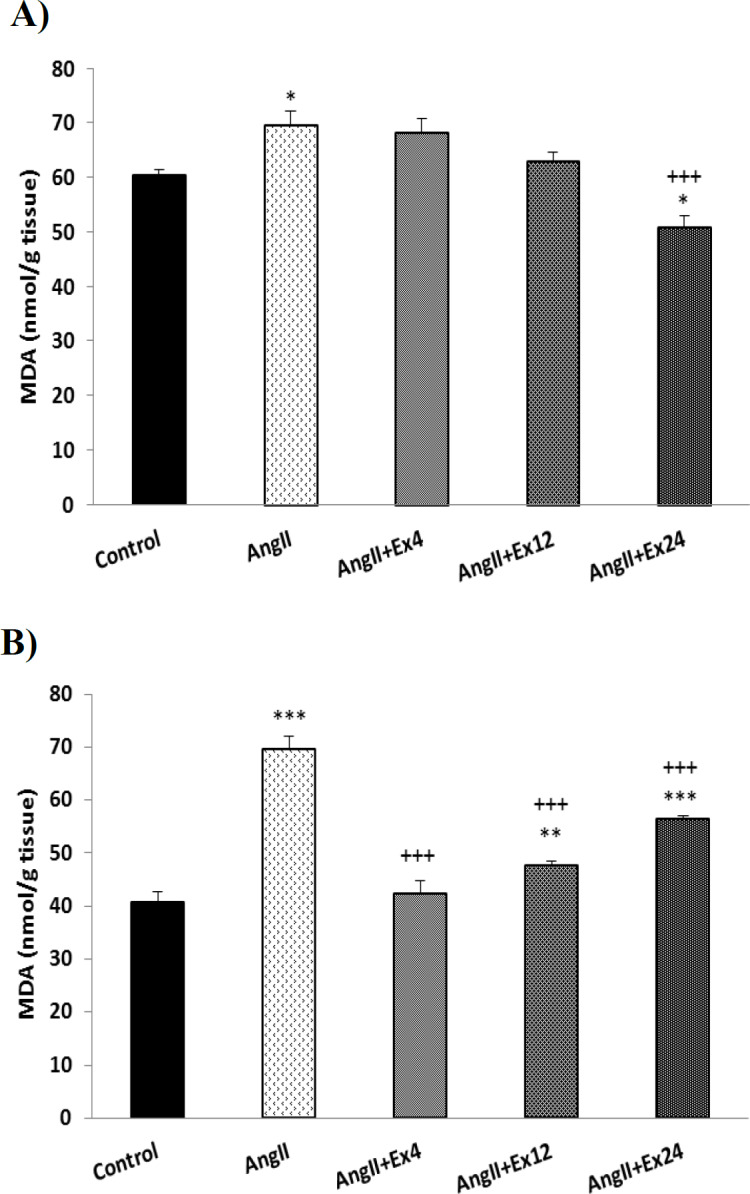
Comparison of the MDA concentration in the heart (A) and aorta (B) tissues. Data are presented as Mean±SEM (n=10 in each group). *p<0.05, **p<0.01 and ***p<0.001 compared to Control group. +++p<0.001 compared to AngII group

Comparison of the MDA concentration in the heart (A) and aorta (B) tissues. Data are presented as Mean±SEM (n=10 in each group). *p<0.05, **p<0.01 and ***p<0.001 compared to Control group. +++p<0.001 compared to AngII group