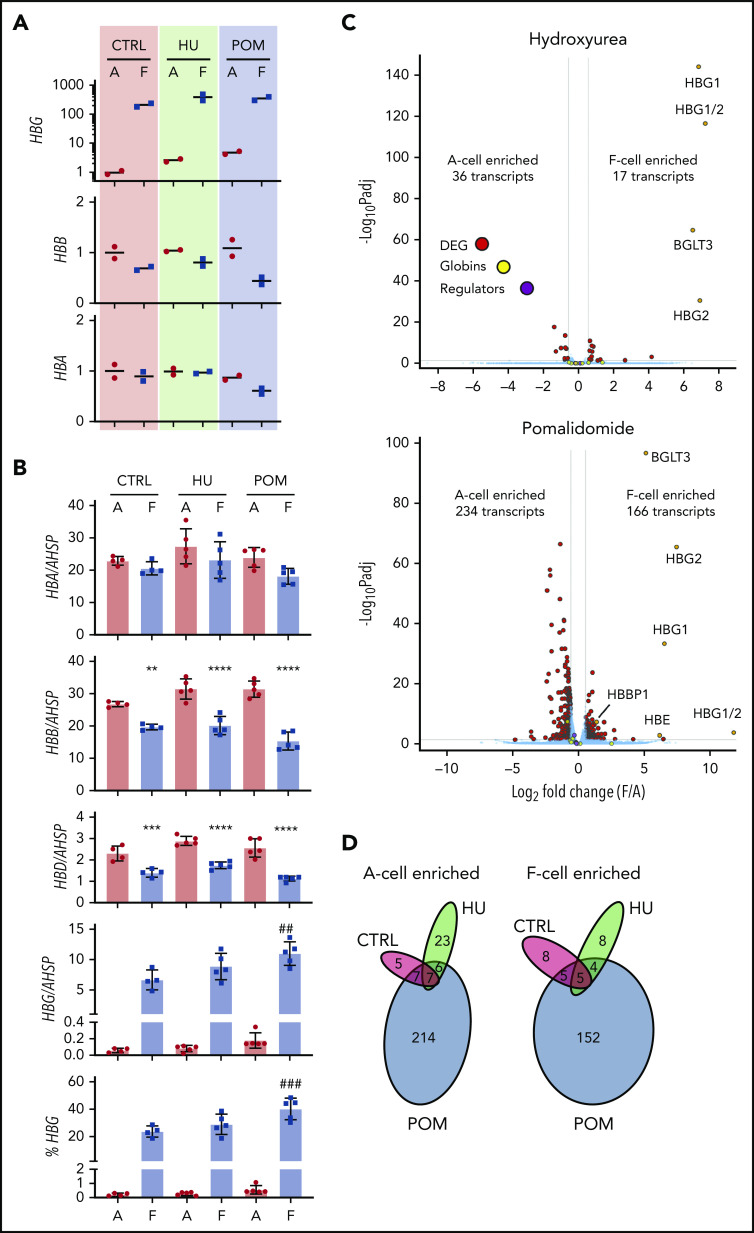
Figure 5.
F-cell analysis after treatment with hydroxyurea and pomalidomide. Primary erythroid cultures from 2 donors were treated with vehicle (CTRL), hydroxyurea (HU), or pomalidomide (POM) starting on day 6 of culture. F and A erythroblasts were sorted on day 11 of culture. (A) RT-PCR analysis of globin transcript expression, normalized to mean expression of 3 housekeeping genes and shown relative to untreated A cells. (B) Globin transcript analysis by ddPCR in treated cells from a total of 5 donors. All graphs show individual data points as well as mean ± SD. **P < .01 vs A cells; ***P < .001 vs A cells; ****P < .0001 vs A cells; ##P < .01 vs control F cells; ###P < .001 vs control F cells by 1-way analysis of variance. (C) RNA-seq data comparing A and F cells in hydroxyurea (top) and pomalidomide (bottom) cultures. Average data from 2 replicates is shown. FDR <0.05; fold change >1.5. Globin transcripts and known HbF regulators (BCL11A, LRF, EIF2AK1, and SPOP) are highlighted. (D) Venn diagrams showing overlap of F-cell enriched or A-cell enriched transcripts between different treatment conditions.

