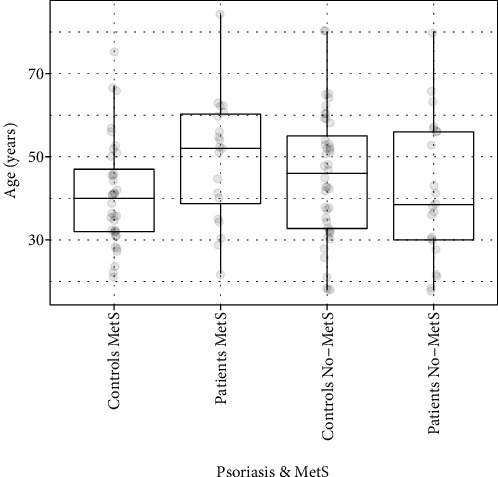
Figure 1.

Age characteristics of monitored groups. Legend: data are graphically displayed as box blots (the minimum value is represented by points below the box, 1st line (bottom) of the box represents first quartile (Q1), 2nd (middle of the box) median, 3rd (top of the box) third quartile (3Q), points above the box represent the maximum value).
