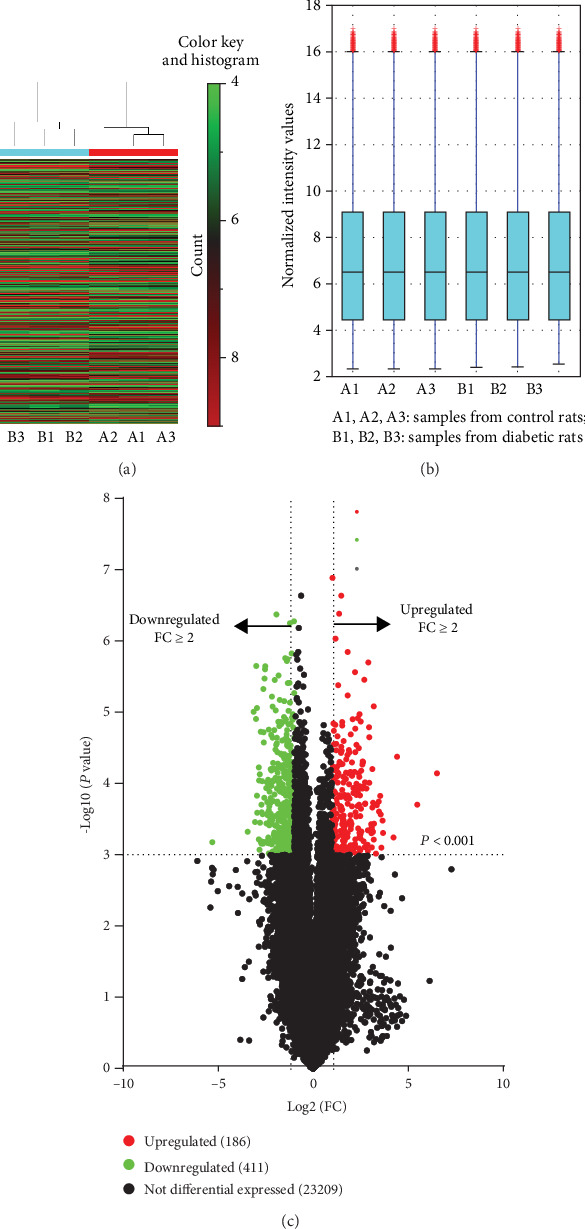
Figure 3.

Heat map, box plot, and volcano plot of detected genes. 23806 gene IDs and their expression values were obtained after probe ID transformation and expression summarization. Heat map of detected genes from all samples (a). Red indicates higher gene expression, and green indicates lower gene expression. The box plot of the intensity of all samples demonstrated that the expression values of each sample were close to the same after normalization (b). The univariate t-test with a fold change > 2 and P < 0.001 was applied to identify the DEGs between control rats and diabetic rats. 186 upregulated genes (red spots) and 411 downregulated genes (green spots) were identified as the DEGs between groups (c).
