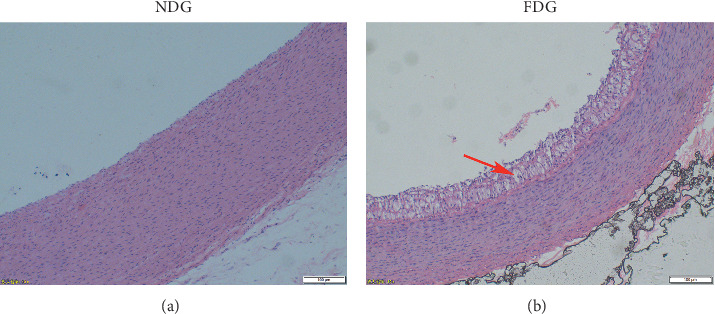
Figure 1.

Representative photomicrographs of aortic arch sections stained with hematoxylin-eosin of a normal diet group (NDG) and a fat diet group (FDG) in the preliminary experiment. Magnification: 10x. Bar represents 100 μm. The red arrow indicates that, compared with the NDG, foam cells formed under the intima in the FDG. Meanwhile, the intima was thickened, and plaques were formed. This showed that the atherosclerosis model was successfully established after a high-fat diet.
