
Figure 4.
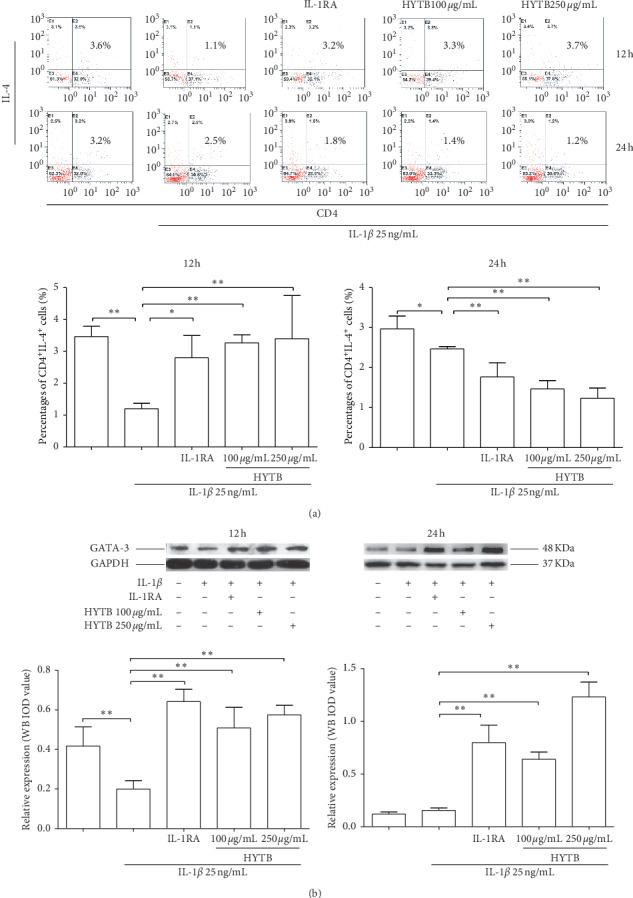
Percentages of CD4+IL-4+ cells and protein expression of GATA-3 in lymphocytes after treatment. (a) Flow cytometry histogram. The results are presented in bar charts. (b) GATA-3 was detected by Western blot analysis. The quantified results are presented in bar charts. GAPDH is used as an internal control. Data are presented as the mean ± SD (n = 3). ∗∗P < 0.01.