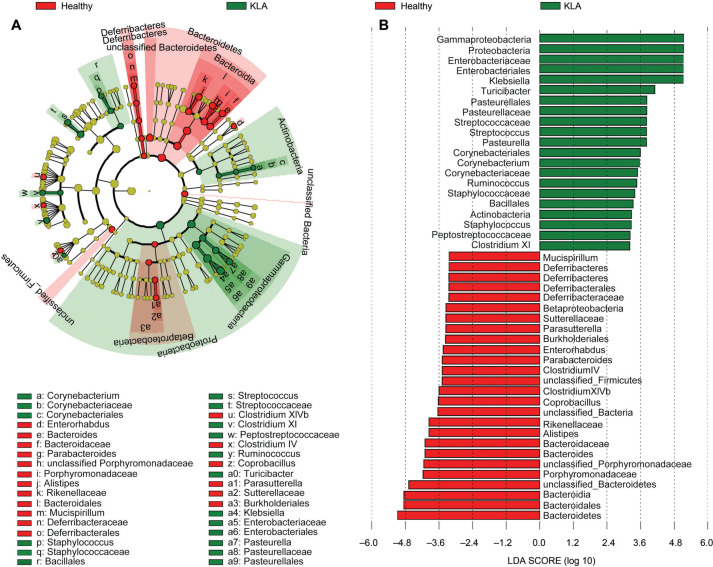
Fig. 2.
The differences in gastric microbiota composition between healthy and KLA groups by LEfSe analysis. Taxonomic cladogram (A) and Linear discriminative analysis (LDA) scores (B) exhibited the different enriched bacteria taxa between healthy group (Red) and KLA group (Green). All of the taxa showed in the figure with LDA threshold value > 2.

