Fig. 2.

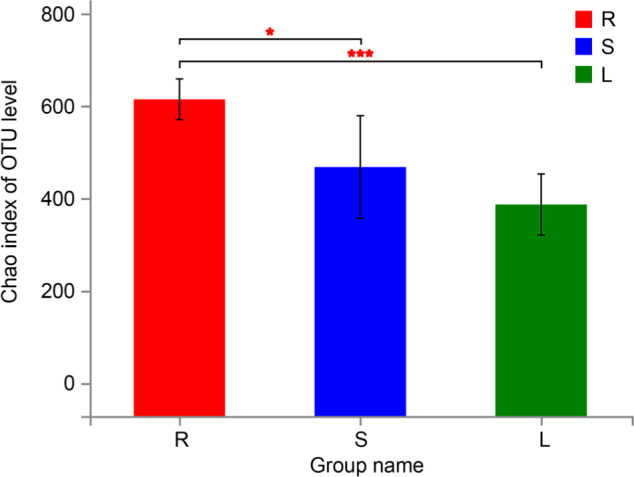
Chao index of OTU level of roots, stems, and leaves (mean ± SD) (n = 6). S represents stems, R represents root, and L represents leaf. (0.01 < p ≤ 0.05 marked as *, 0.001 < p ≤ 0.01 marked as **, p ≤ 0.001 marked as ***).

Chao index of OTU level of roots, stems, and leaves (mean ± SD) (n = 6). S represents stems, R represents root, and L represents leaf. (0.01 < p ≤ 0.05 marked as *, 0.001 < p ≤ 0.01 marked as **, p ≤ 0.001 marked as ***).