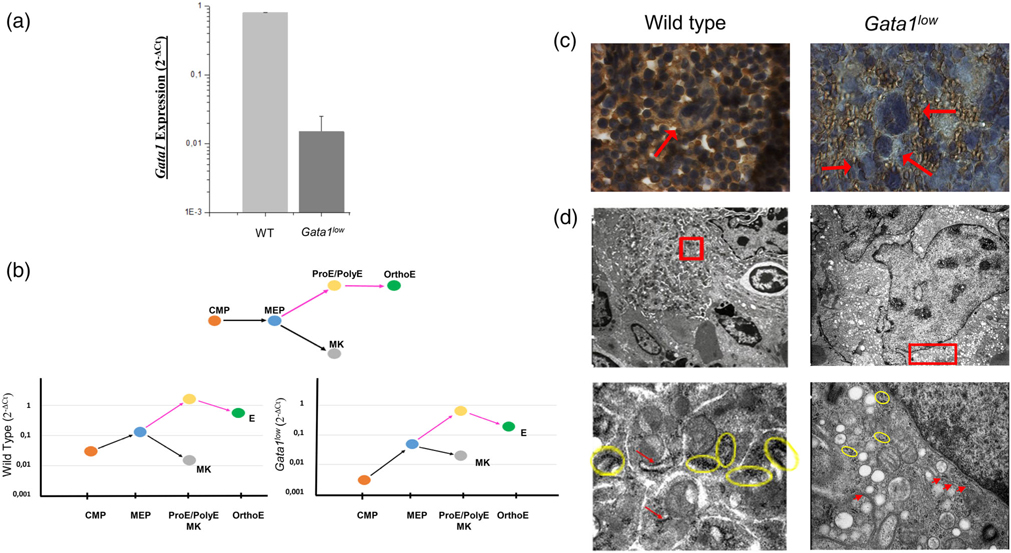
FIGURE 1.
Reduced frequency of ribosomes decreases the GATA1 content in the megakaryocytes from the spleen of Gata1low mice in spite of normal levels of Gata1 mRNA. (a) Quantitative RT-PCR determinations of the levels of Gata1 mRNA expressed by megakaryocytes prospectively isolated from the bone marrow of one-month old wild-type (WT) and Gata1low littermates showing that Gata1low megakaryocytes express reduced levels of Gata1 mRNA. (b) Quantitative RT-PCR determinations of the levels of Gata1 mRNA expressed by common myeloid progenitor cells (CMP, Lin− Sca1− Ly6c− FcεRIα− c-kitpos CD34low CD16/CD32+), bipotent megakaryocyte-erythroid progenitor cells (MEP, Lin− Sca1− Ly6c− FcεRIα− c-kitpos CD34low CD16/CD32low), early (proerythroblasts, ProE, and polychromatic erythroblasts, PolyE) and late (orthochromatic erythroblasts, OrthoE) erythroblasts and megakaryocytes (MK) prospectively isolated from the spleen of WT and Gata1low littermates, as indicated. Gata1low CMP, MEP and erythroid cells express levels of Gata1 mRNA onefold lower than that expressed by the corresponding WT cells while the levels of Gata1 mRNA in Gata1low megakaryocytes is within normal ranges. (c) Immunostaining with a Gata1 specific antibody of the spleen from WT and Gata1low littermates. The nuclei of WT megakaryocytes, but not those from Gata1low littermates, were readily stained by the antibody. Megakaryocytes are indicated by arrows. Magnification ×100. (d) Transmission electron microscopy of representative megakaryocytes, top panels, from WT and Gata1low littermates and details of their perinuclear area (bottom panels). The detail of the Gata1low megakaryocyte indicate the presence of a poorly developed rough endoplasmic reticulum with reduced numbers of polysomes (indicated by the yellow circles). Magnifications ×4,400 and ×30,000 in the top and bottom panels, respectively. Yellow Circles indicated polyribosomes and red arrows show poorly developed rough endoplasmic reticulum. Similar results were published in References 22 and 39

