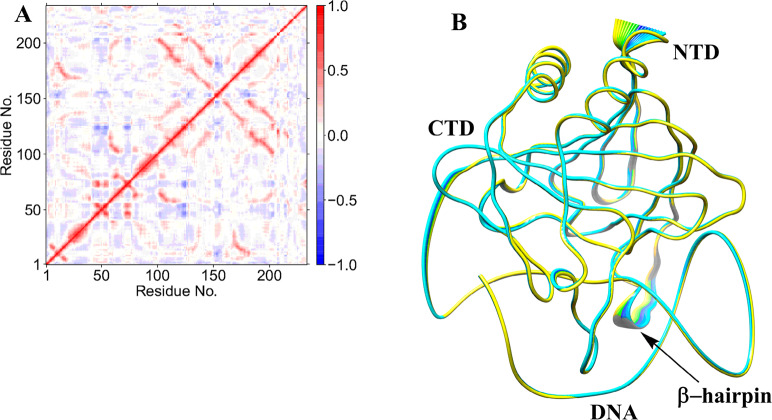
Figure 9.
Dynamic cross correlation (A) and principal component analysis (B) for AlkBH2–dsDNA at the ferryl complex stage. In part A, residue numbers are as follows: 1–206 (protein), 207 (Fe), 208 (O), 209 (succinate), 210–235 (DNA), and 216 (m3C substrate). NTD and CTD are the N-terminal domain and C-terminal domain, respectively. Yellow to blue represents the direction of motion of protein residues in part B.

