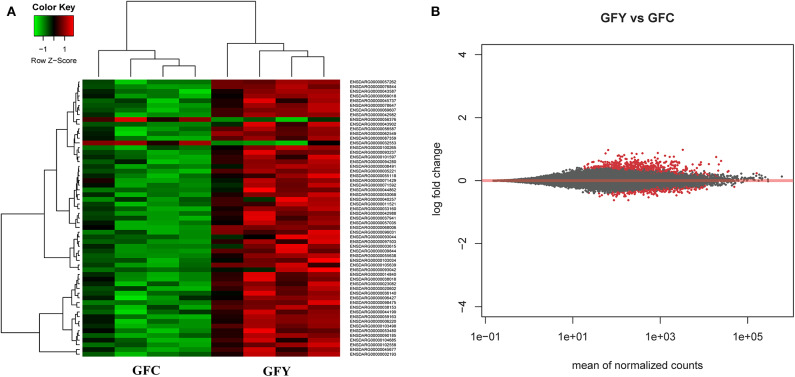
Figure 2.
Heat map (A) and MA plot (B) of differentially expressed genes in GFY (gfy 1–4) compared to GFC (gfc 1–4). Each group comprise four biological replicates. The X-axis and Y-axis in the MA plot denote the mean normalized counts and log2 fold changes between the two groups, respectively. All differentially expressed genes with adjusted p-value below 0.05 are shown in red. The heat map only includes transcripts with |fold-change| > 1.5. GFC, Germ-free control and GFY, germ-free yeast-exposed.

