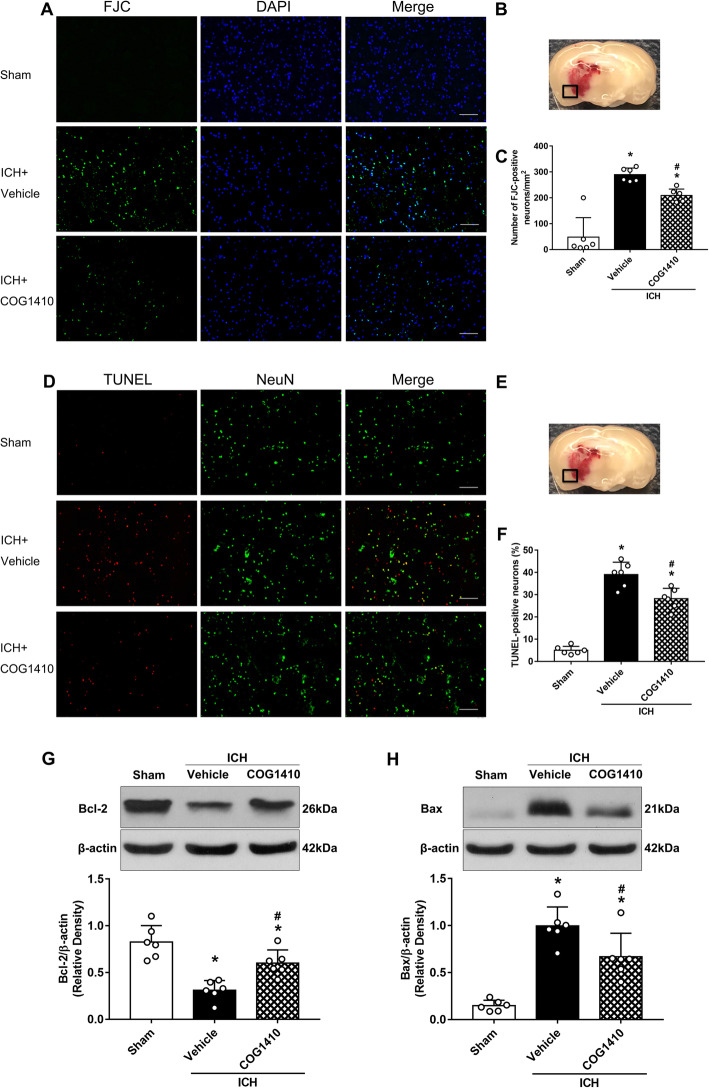
Fig. 5.
The effects of COG1410 on neuronal apoptosis and proinflammatory factors after ICH. a, d Representative images of FJC (green), and the colocalization of TUNEL (red) with neurons (NeuN, green) in the perihematomal area at 24 h after ICH. b, e Brain sample with schematic illustration showing the area (indicated by black squares) used for FJC and TUNEL counting in the perihematomal region. c, f Quantitative analyses of FJC and TUNEL-positive cells in the perihematomal area at 24 h after ICH. g, h Representative western blot bands and quantitative analyses of TNF-α and IL-1β protein levels in the ipsilateral hemisphere at 24 h after ICH. *p < 0.05 vs. sham, #p < 0.05 vs. ICH + vehicle. Error bars are represented as mean ± SD. n = 6 per group

