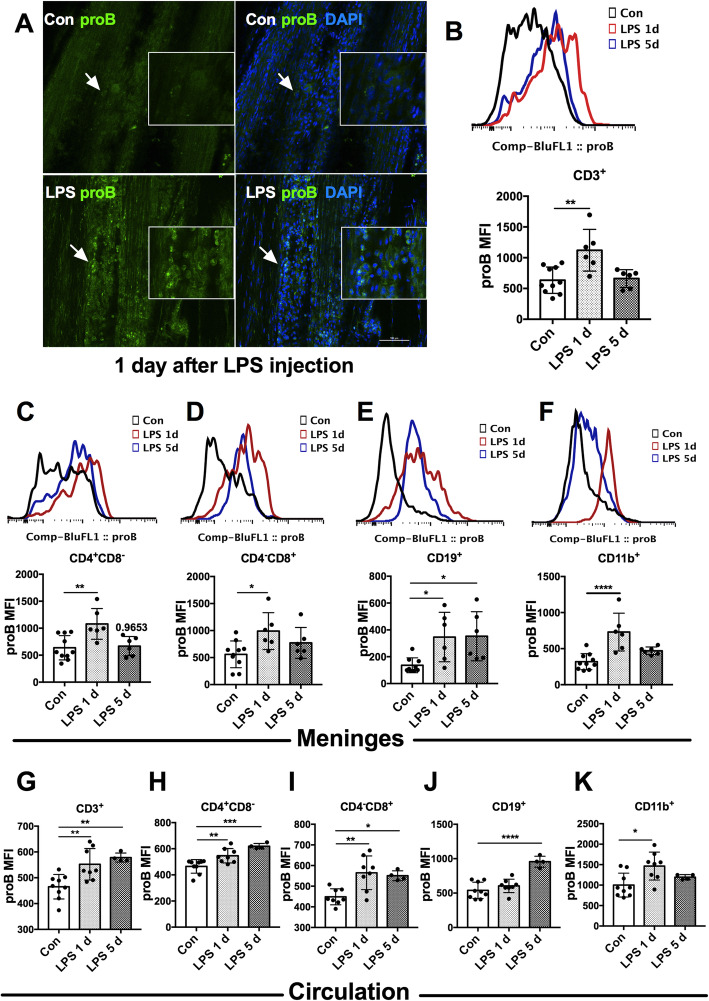
Fig. 5.
Increased proBDNF expression in meningeal and peripheral blood immune cells in septic mice. Mice were i.p. injected with LPS (5 mg kg−1) and meninges and peripheral blood were harvested for immunofluorescence staining or flow cytometry. a Representative whole mount meningeal immunofluorescence images showed markedly increased proBDNF-positive staining cells in the meninges in mice at 1 day after LPS injection compared to saline injected mice. The high magnification images around the arrows are displayed in a white square as insets. Bar = 100 μm. b–f Representative meningeal single cell flow cytometry images (upper panel) and its statistical analysis (lower panel) indicated that proBDNF MFI was increased in meningeal b CD3+ T cells, c CD4+ T cells, d CD8+ T cells, and f CD11b+monocytes/macrophages at 1 day after LPS injection. proBDNF in meningeal e CD19+ B cells upregulated until 5 days after LPS injection. n = 10 in the Con group, n = 6 in LPS groups. g–k Upregulation of proBDNF in g CD3+ T cells, h CD4+ T cells, i CD8+ T cells, j CD19+ B cells, and k CD11b+ monocytes/macrophages in peripheral blood in LPS-injected mice were detected. n = 9 in Con group, n = 8 in the LPS1d group, n = 4 in the LPS 5d group. Data b–k were analyzed by one-way ANOVA and followed by Tukey post hoc test, *P < 0.05, **P < 0.01, ***P < 0.001, ****P < 0.0001. Data are presented as mean ± SEM. proB = proBDNF, Con = saline injected control. LPS 1d = 1 day after i.p. LPS injection. LPS 5d = 5 days after i.p. LPS injection. i.p. = intraperitoneal. MFI = mean fluorescence intensity

