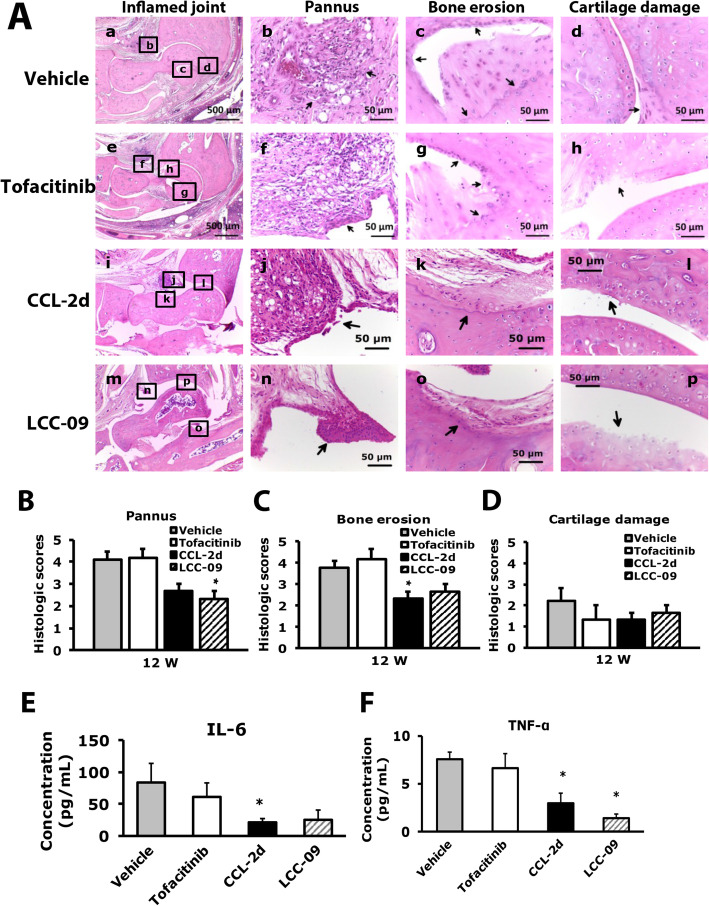
Fig. 7.
Histology of ipsilateral side joints in compound-treated RA mice. Histology of joints from vehicle- or compound-treated mice at week 12 stained with hematoxylin and eosin. A Inflamed joint images (a, e, i m). a for vehicle-treated, e for tofacitinib-treated, i for CCL-2d-treated, m for LCC-09-treated; the small letters (b, c, d, f, g, h, j, k, l, n, o, p) in the inflamed joint images represent the regions that were amplified in pannus (b, f, j, n), bone erosion (c, g, k, o), and cartilage damage (d, h, l, p) images. B–D Data are mean ± SEM severity score for histological scores for pannus (B), bone erosion (C), and cartilage damage (D). *p < 0.05 compound- vs vehicle-treated group by one-way ANOVA. E Serum level of IL-6 *p < 0.05, compound-treated vs vehicle-treated group by one-way ANOVA. F Serum level of TNF-α. Data are mean ± SEM of total tested mice (n ≥ 6 per group). *p < 0.05, compound-treated vs vehicle-treated group by one-way ANOVA

