. 2020 May 8;19:596–612. doi: 10.17179/excli2019-2082

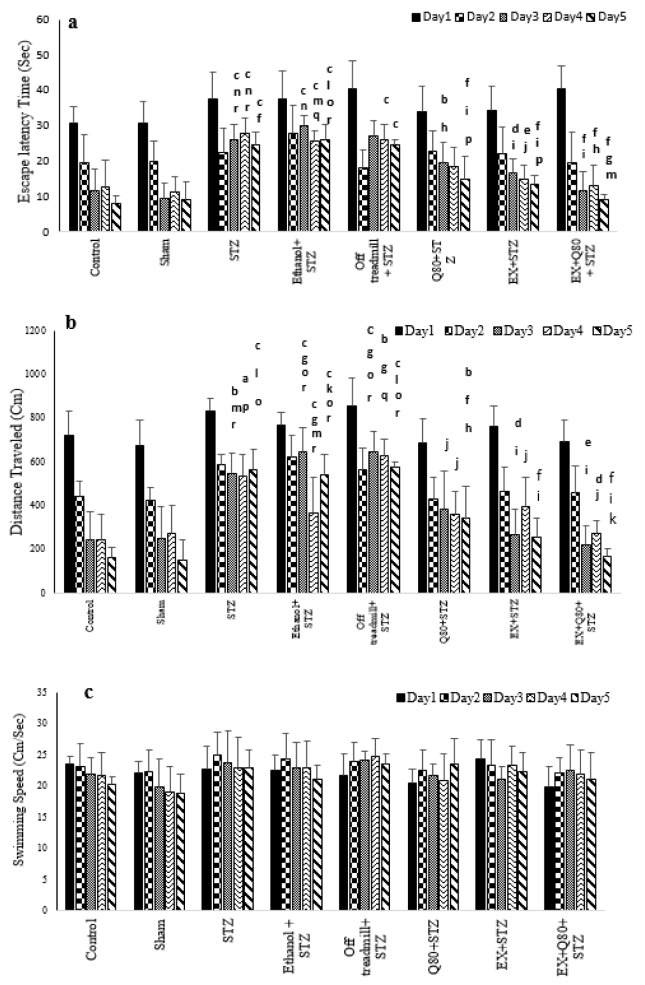
Figure 1. Spatial memory was evaluated as a function of training day according to the following parameters: (a) Escape latency, (b) Traveled distance, and (c) Swimming speed. Data are presented as the mean ± standard deviation (SD) (n = 7 animals). Significantly different from sham (a p<0.05, b p<0.01, c P<0.001), significantly different from STZ (d p<0.05, e p<0.01, f P<0.001), significantly different from Ethanol+STZ (j p<0.05, h p<0.01, i P<0.001),significantly different from Q80+STZ (g p<0.05, k p<0.01, l P<0.001), significantly different from EX+STZ (m p<0.05, n p<0.01, o P<0.001), significantly different from Q80+EX+STZ (p p<0.05, q p<0.01, r P<0.001).

Figure 1