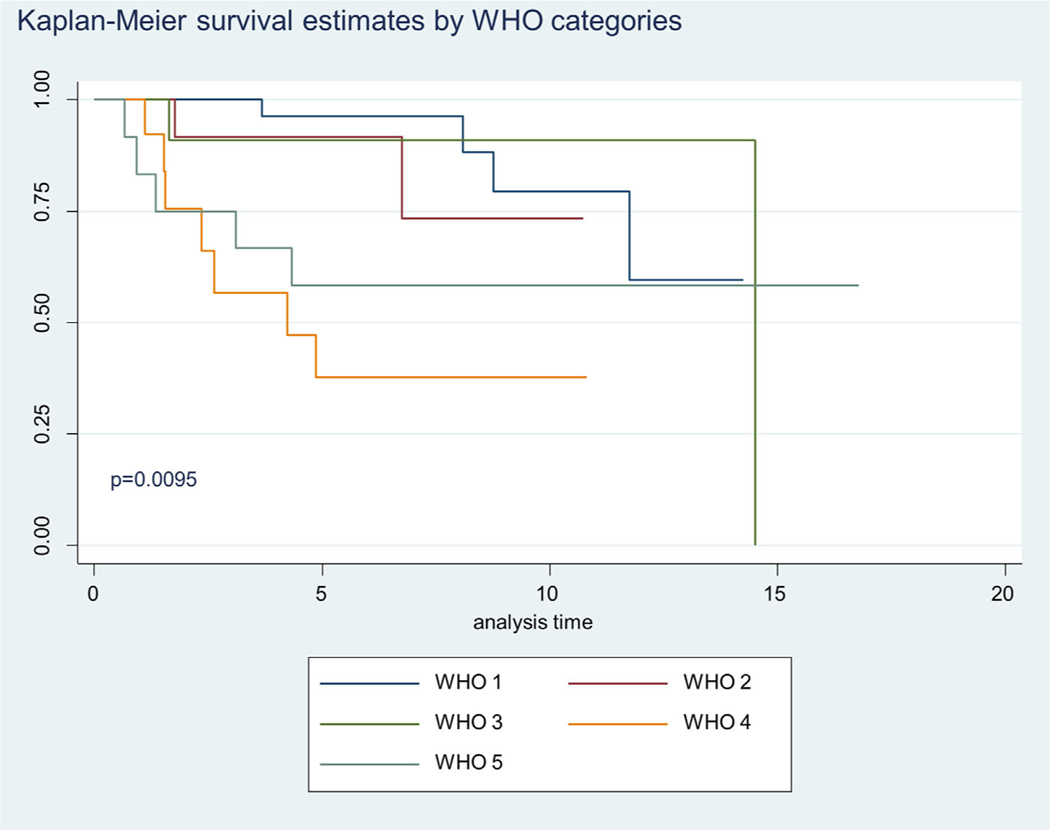
FIGURE 2.
Demonstrates Kaplan-Meier 5 year survival estimates for WHO1, WHO2, WHO3, WHO4, and WHO5 Gleason score categories. Of all the pairwise comparison WHO4 and WHO1 Gleason score categories showed significant differences at P = 0.0095. [Color figure can be viewed at wileyonlinelibrary.com]

