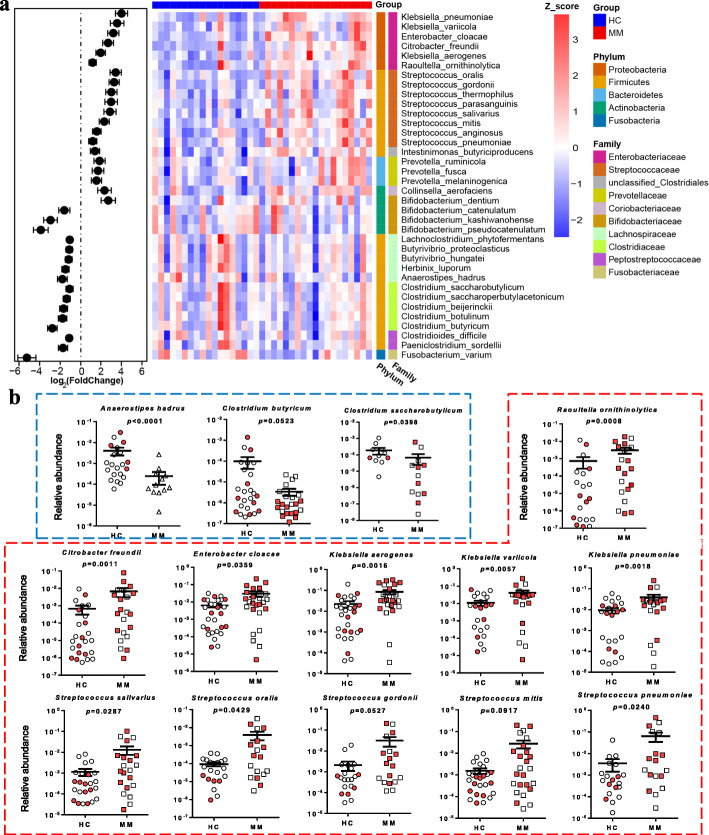
Fig. 2.
Species with differential abundance in HC and MM subjects of the cohort. a Left panel: the fold change of abundance of 36 different species in MM in relation to HC. Right panel: heatmap shows the scaled logarithm base-10 of the abundance of 20 MM-enriched species and 16 HC-enriched species. b Graphs indicate the species with significant differential abundance in an expanded cohort as verified using qPCR. HC-enriched species are highlighted in blue frame, while MM-enriched species in red frame. In HC, circles in red and white represent the subjects from a new collection of controls and metagenomic sequenced group, respectively. In MM, squares in red and white represent the subjects from a new collection of MM patients and metagenomic sequenced group, respectively. P value was determined by using two-tailed Mann-Whitney test. Note that some species were undetected in some samples in Fig. 2b. There are 6 and 4 undetected samples for Anaerostipes hadrus and Clostridium saccharobutylicum, respectively. And, there are 9, 3, 2, and 3 undetected samples for Raoultella ornithinolytica, Citrobacter freundii, Klebsiella variicola, and Klebsiella pneumoniae, respectively

