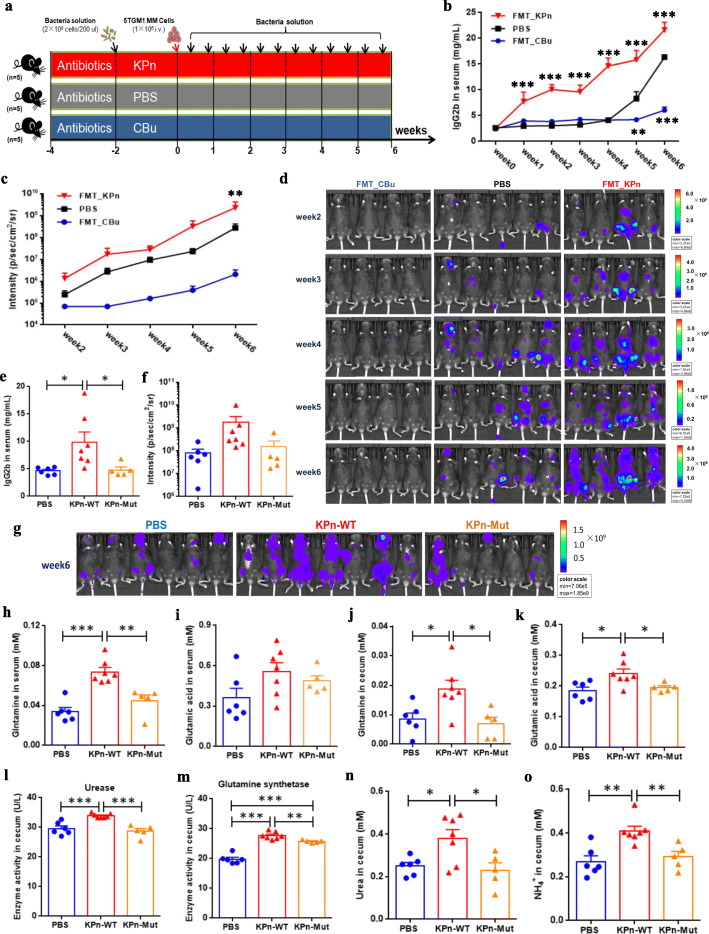
Fig. 7.
Mice experiment with Klebsiella pneumoniae and Clostridium butyricum. a Schematic representation of the characteristic bacteria transplantation experiment. b, c Lines in blue, in black, and in red denote the concentration of serum lgG2b (b) and the fluorescence intensity of live imaging (c) in FMT_CBu, PBS, and FMT_KPn mice, respectively. P value was determined by using two-way ANOVA test. d Live imaging of all recipient mice. e, f At week 6, the IgG2b concentration (e) and the tumor fluorescence intensity (f) in PBS, KPn_WT, and KPn_Mut mice, respectively. g, h At week 6, the concentrations of serum glutamine (g) and glutamic acid (h) in PBS, KPn_WT, and KPn_Mut mice, respectively. i, j At week 6, the concentrations of cecal glutamine (i) and glutamic acid (j) in PBS, KPn_WT, and KPn_Mut mice, respectively. k, l The activities of cecal urease (k) and glutamine synthase (l) in PBS, KPn_WT, and KPn_Mut mice, respectively. m, n The concentrations of cecal urea (m) and NH4+ (n) in PBS, KPn_WT, and KPn_Mut mice, respectively. P value was determined by using two-tailed unpaired t test. *P < 0.05, **P < 0.01, ***P < 0.001

