
Figure 5.
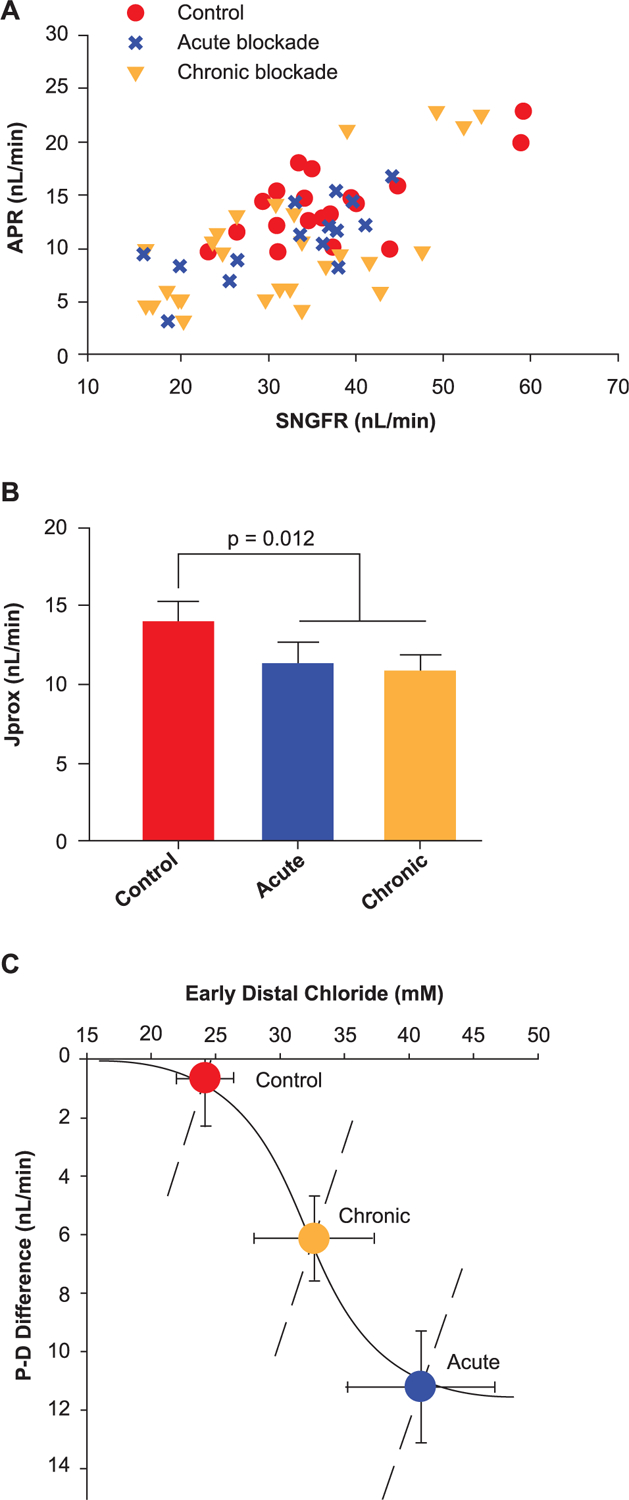
Acute effects and chronic effects with SGLT2 blockade on tubular reabsorption in Wistar Froemter rats with early diabetes.14 (A) Individual late proximal tubular fluid collections showing APR as a function of SNGFR. (B) Proximal reabsorption adjusted for SNGFR by ANCOVA (APR). Collections were made without perfusing Henle’s loop, so each point represents the shoulder of a TGF curve. (C) Degree of TGF activation (P-D difference [proximal minus distal]) as a function of the TGF stimulus (CED). The solid curve is a hyperbolic tangent parameterized to represent the acute TGF response. The dashed lines represent the forward effects of SNGFR on CED as a result of glomerulotubular balance. Superimposed on this graph are the operating points (mean § SE) for the 3 phases of SGLT2 blockade in Wistar Froemter rats. This figure illustrates 2 salient features of the transition from acute to chronic SGLT2 blockade. ANCOVA = analysis of covariance; APR = absolute proximal reabsorption; CED = early distal chloride concentration; SE = standard error; SGLT2 = sodium-glucose co-transporter 2; SNGFR = single-nephron glomerular filtration rate; TGF = tubuloglomerular feedback. Adapted from Thomson SC, et al. Acute and chronic effects of SGLT2 blockade on glomerular and tubular function in the early diabetic rat. Am J Physiol Regul Integr Comp Physiol. 2012; 302: R75–R83. Copyright © 2012, The American Physiological Society.