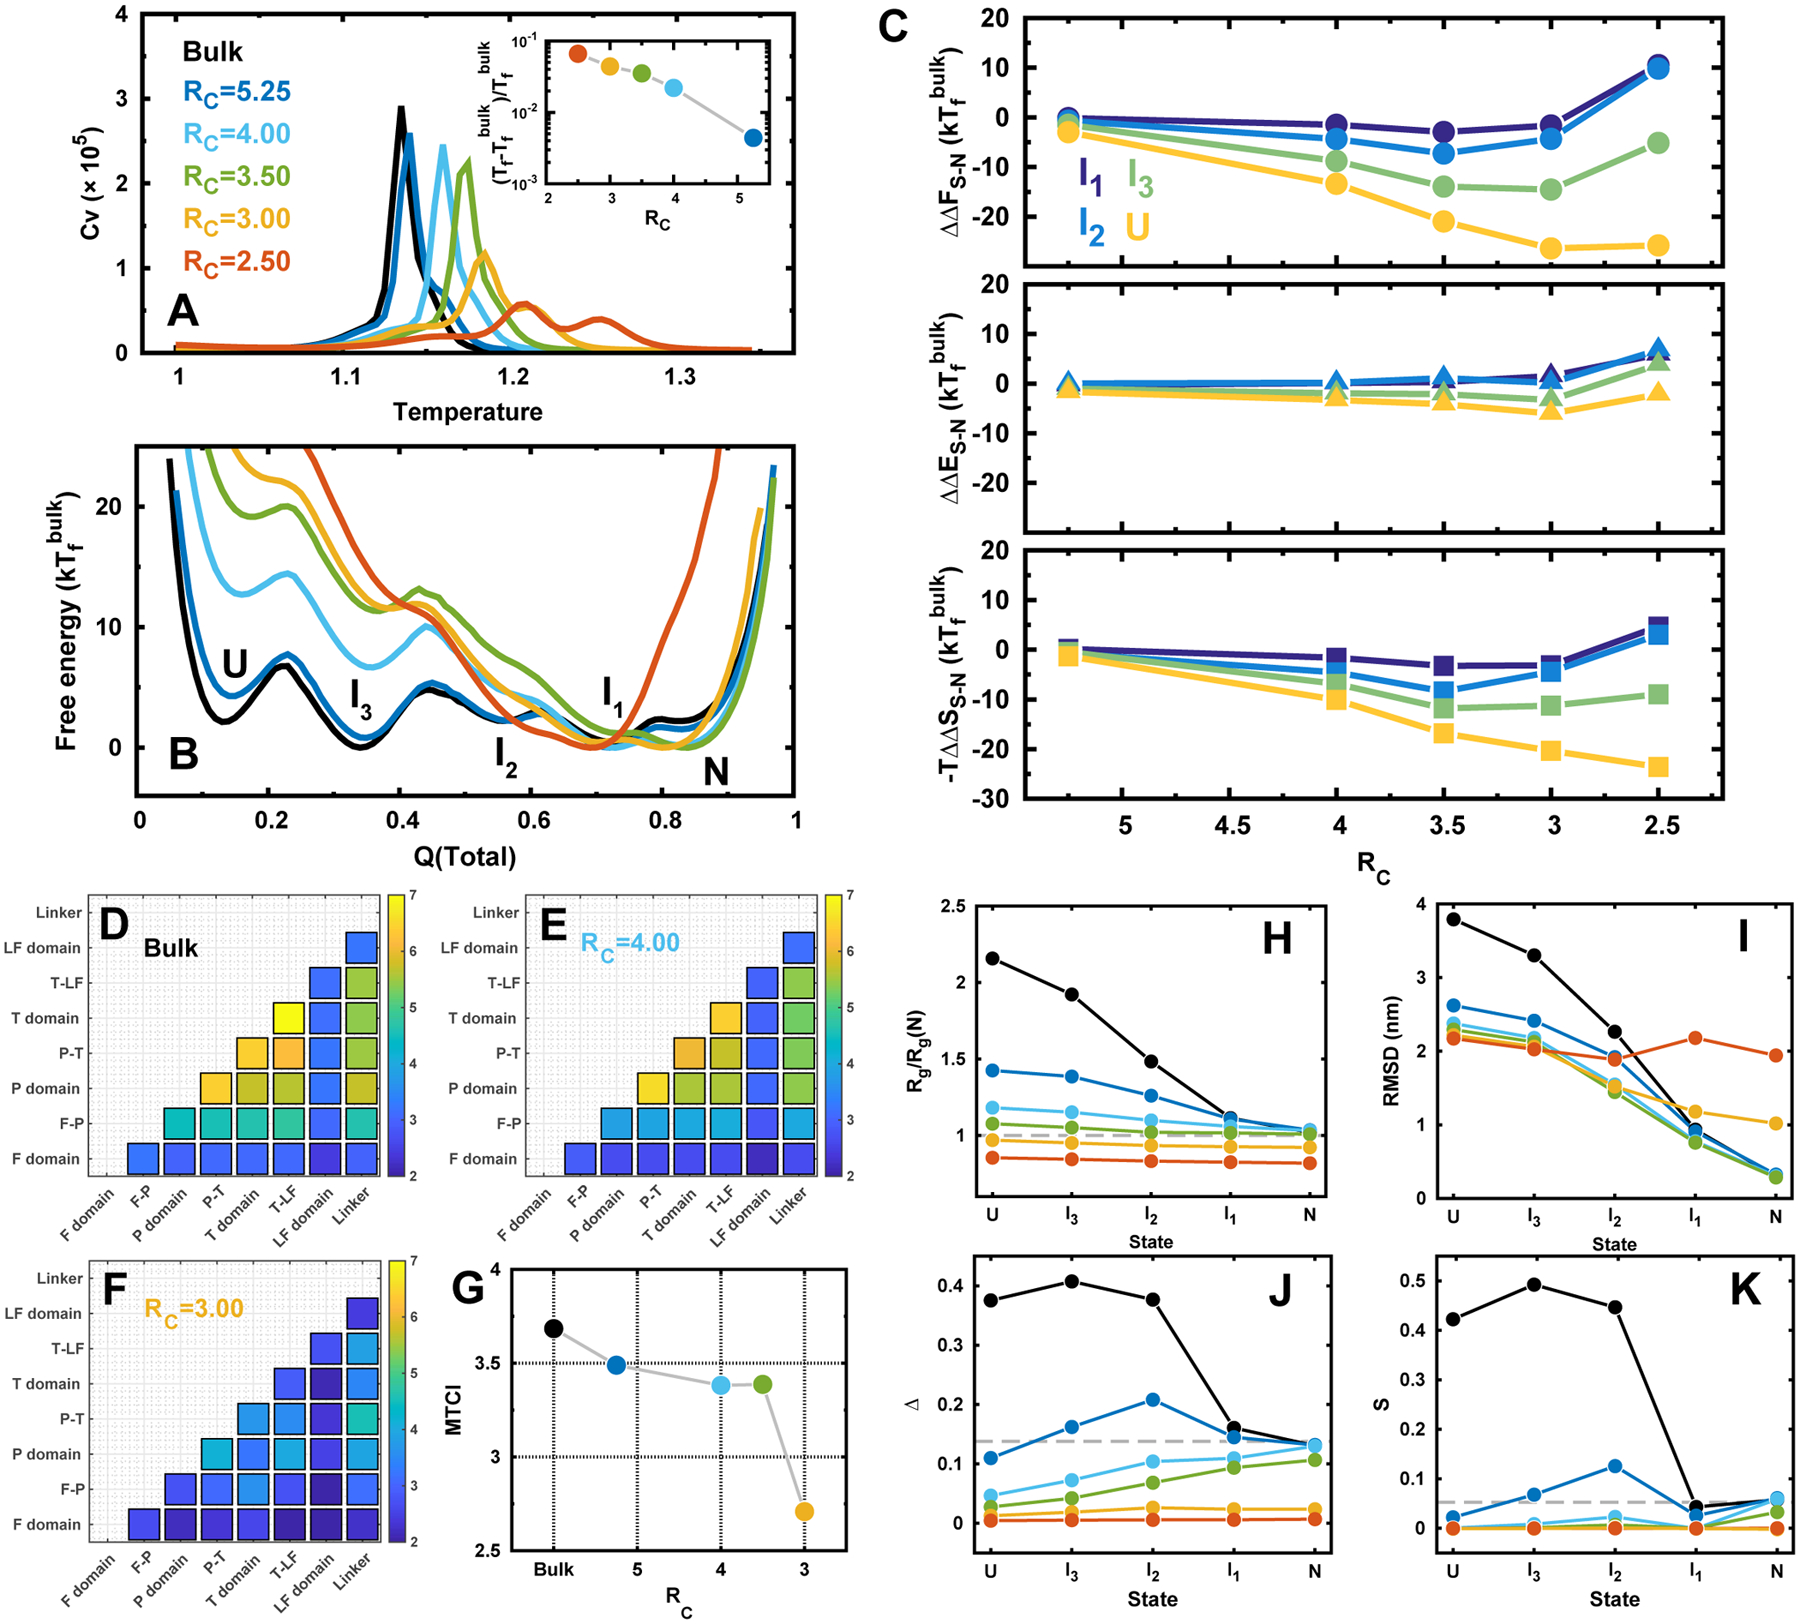
Figure 2.

DPO4 folding in bulk and under confinements. (A) Heat capacity curves of DPO4 folding. Inset shows the folding temperature Tf changes with different confinements. Folding temperature is defined as the most prominent peak position from the heat capacity curve. RC is the radius of spherical confinement, so a small value of RC corresponds to a strong confinement. RC is in the unit of nm. (B) 1D free energy landscapes along Q(total) under different confinements at the folding temperature of the bulk condition . Q(total) is the fraction of total native contacts of DPO4. There are multiple states formed during the folding process indicated as “U, I3, I2, I1, N”, corresponding to the unfolded states, three intermediate states, and native folded states, respectively. (C) The relative change of the differences in free energy (top), energy (middle), and entropy (bottom) for different folding states of DPO4 to that in bulk along with the different strengths of confinement. The free energy difference between the proceeding state “S” and “N”, where “S” can be any intermediate or unfolded states, is expressed as ΔFS–N = FN – FS. The change of the free energy led by confinement is then expressed as ΔΔFS–N = ΔFS–N(RC) – ΔFS–N(bulk). Similar calculations were applied to the changes of difference in energy ΔΔES–N and entropy ΔΔSS–N from simulation with confinement to that in bulk. (D–F) Folding cooperativity quantity TCI for DPO4 folding in bulk and under confinements. (G) MTCI along with RC. (H–K) Structural characterizations of the folding states during DPO4 folding process under different confinements. (H) Radius of gyration Rg of each state in DPO4 folding under different confinements. Rg(N) is the Rg of PDB structure.47 (I) RMSD to PDB structure of each state during DPO4 folding under different confinements. (J) Asphericity Δ and (K) shape S parameters of each state during DPO4 folding under different confinements. The dashed lines indicate the values at native PDB structure.
