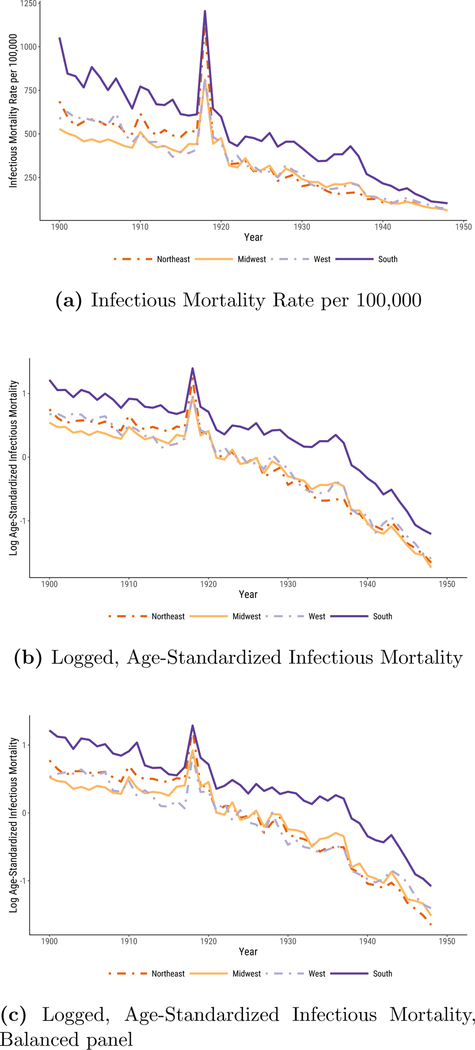
Figure 1:
Infectious Mortality, Standardized and Unstandardized, in U.S. Cities by Region. In 1a, we report regional medians of mortality rates per 100,000. In 1b and 1c, infectious mortality is standardized to eliminate variation in the age distributions of cities; the trend lines depict the logged ratio of actual to expected infectious mortality, based on the city’s age distribution.

