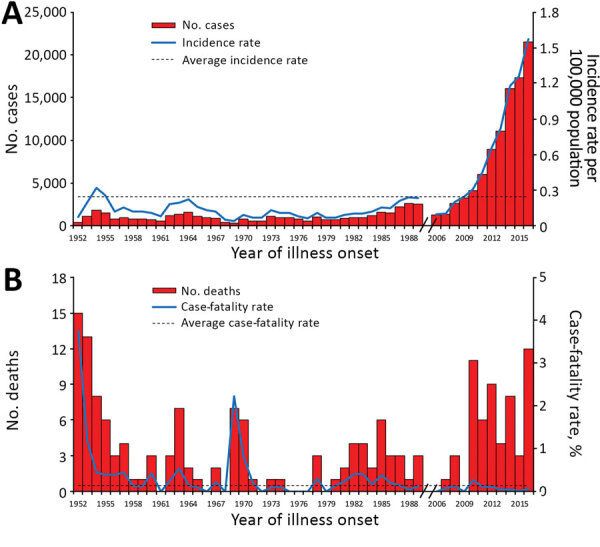
Figure 1.

Reported cases and deaths of scrub typhus in China, 1952–2016. A) Aggregated number of cases by year (red bars), annual incidence rate (blue line), and average annual incidence rate (black dashed line) per 100,000 residents. B) Aggregated number of deaths by year (red bars), case-fatality ratio (blue line), and average annual case-fatality ratio (black dashed line). The data from 1990–2005 are missing because surveillance for scrub typhus was suspended during the period.
