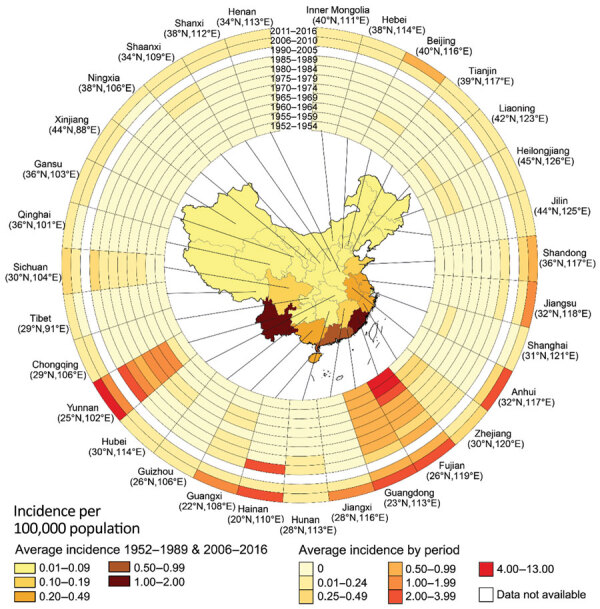
Figure 2.

Incidence rate of scrub typhus for each province of China during 1952–1989 and 2006–2016, by time period. Annual average incidence of scrub typhus per 100,000 population in the 31 provinces investigated is shown. The rings contain data for 11 periods studied; the innermost ring shows data for early periods of 1952–1954, and the outermost ring data for 2011–2016. The latitude and longitude of the capital city of each province are shown.
