
Figure.
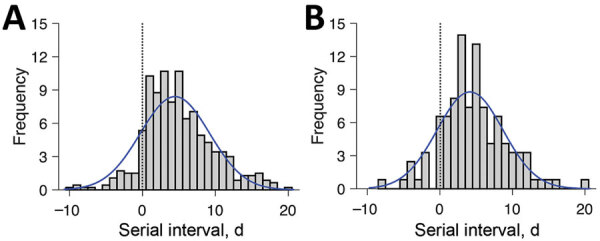
Estimated serial interval distribution for coronavirus disease (COVID-19) based on 468 reported transmission events, China, January 21–February 8, 2020. A) All infection events (N = 468) reported across 93 cities of mainland China as of February 8, 2020; B) the subset infection events (n = 122) in which both the infector and infectee were infected in the reporting city (i.e., the index patient’s case was not an importation from another city). Gray bars indicate the number of infection events with specified serial interval, and blue lines indicate fitted normal distributions. Negative serial intervals (left of the vertical dotted lines) suggest the possibility of COVID-19 transmission from asymptomatic or mildly symptomatic case-patients.