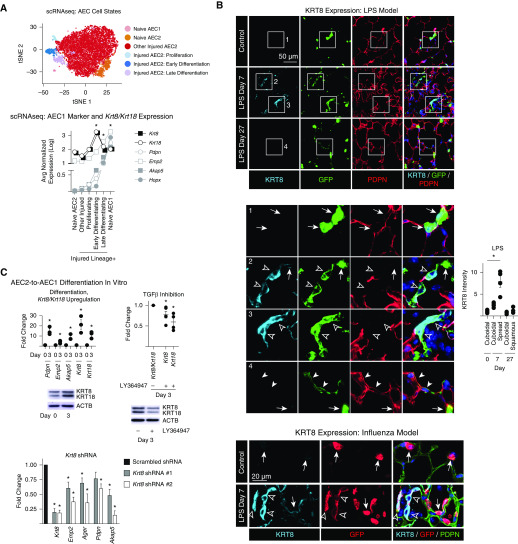
Figure 1.
Physiologic differentiation of type 2 alveolar epithelial cells (AEC2s) into AEC1s proceeds via early KRT8/KRT18hi, TGF-β (transforming growth factor β)–activated and late KRT8/KRT18lo, TGF-β–deactivated transitional cell states. (A and B) SftpcCreERT2+/−;mTmG+/− mice previously administered tamoxifen were exposed to intratracheal LPS (40 μg Escherichia coli 0111:B4) or intranasal H1N1 influenza virus (100 plaque-forming units, strain A/PR/8/34) or left untreated. At Day 7, green fluorescent protein (GFP)+ Tomato− cells isolated from naive and LPS-treated mice and GFP− Tomato+ EPCAM+ PDPN+ cells isolated from naive mice were subjected to single-cell RNA sequencing (scRNAseq). Unsupervised clustering was performed and the cell types and states shown on t-distributed stochastic neighbor embedding (tSNE) plots were identified using known markers (4). (The tSNE plot was reprinted by permission from Reference 4.) Expression of the indicated AEC1 markers and Krt8 and Krt18 is shown on the graph; n = 2 mice per group; Wilcoxon rank sum test with Bonferroni correction. *P < 0.01 for Krt8, Krt18, Pdpn, Emp2, Akap5, and Hopx in the early differentiation state compared with all other cells sequenced. *P < 0.01 for Pdpn, Emp2, Akap5, and Hopx in the late differentiation state compared with all other cells sequenced. *P < 0.01 for Pdpn, Emp2, Akap5, and Hopx in naive AEC1s compared with all other cells sequenced. (B) Lung sections were stained with the indicated antibodies. Insets 1–4 are enlarged below. Arrows indicate cuboidal AEC2s with KRT8 expression that was low or undetectable at the exposure settings used (KRT8 was detected in cuboidal AEC2s with higher exposure [data not shown]). Open arrowheads indicate lineage-labeled cells with a transitional, spread morphology but no detectable PDPN, consistent with early differentiation. These cells express high levels of KRT8. Solid arrowheads indicate lineage-labeled cells with a squamous morphology that express PDPN, consistent with late differentiation, but have low KRT8 expression. DAPI is represented by the dark blue stain. The fluorescence intensity of KRT8 was measured in the injured areas using LCmicro software (Olympus), and the average intensity of cuboidal, partially spread, or squamous cells per mouse is shown; n ≥ 4 mice/group; *P < 0.05 by Kruskal-Wallis test with Dunn’s multiple comparisons. (C) Rat AEC2s were isolated as previously described (4) and cultured in Dulbecco’s modified Eagle medium + 10% fetal bovine serum. Quantitative PCR and Western blotting were performed. Differentiation, Krt8/Krt18 upregulation: AEC1 markers, Krt8, and Krt18 are upregulated by Day 3 of culture. Data are shown as the fold change compared with expression levels at Day 0 for each gene. TGF-β inhibition: the TGF-βRI kinase inhibitor LY364947 attenuated Krt8/Krt18 upregulation. Data are shown as the fold change compared with expression levels without the inhibitor for each gene. Krt8 shRNA: cells were transduced with lentivirus (prepared by the University of Michigan Vector Core) containing one of two distinct shRNA constructs (TRCN0000325589 and TRCN0000091874) cloned into the pLKO.1 vector (Sigma). Data are shown as the fold change compared with expression levels with the scrambled shRNA for each gene. Krt8 knockdown attenuated upregulation of AEC1 markers. Fold change was calculated by the 2−ddCt method using PPIB as the housekeeping gene. Each data point represents one experiment performed on cells isolated from one animal; the data point is the average of two technical replicates. *P < 0.05 by two-tailed t test. Mean ± SEM is shown. EPCAM = epithelial cell adhesion molecule; PDPN = podoplanin.

