Figure 7.
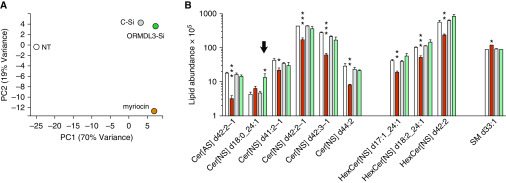
Lipidomics analysis of HeLa myriocin treatments and siRNA transfections. HeLa cells were treated in triplicate with 10 μg/ml myriocin or transfected with control or ORMDL3 siRNA for 72 hours. Cells were pelleted and processed for analysis by lipid mass spectrometry. (A) Principal components analysis of the means for the different treatment groups. (B) Sphingolipids displaying at least one significant difference between a treatment group (myriocin or ORMDL3 siRNA) and the untreated controls when adjusted for false discovery rate (q-values designated with asterisks) and at least a 0.7-fold change. The eight ceramide species significantly impacted by control siRNA alone are not shown. Note the log scale. Arrow: ceramide species significantly increased by ORMDL3 siRNA. *P ≤ 0.05, **P ≤ 0.01, and ***P ≤ 0.005. Cer[AS] = ceramide species α-hydroxy fatty acid sphingosine; Cer[NS] = ceramide species non-hydroxy fatty acid sphingosine; HexCer[NS] = hexosylceramide non-hydroxy fatty acid sphingosine species; PC = principal compontent; SM = sphingomyelin.

