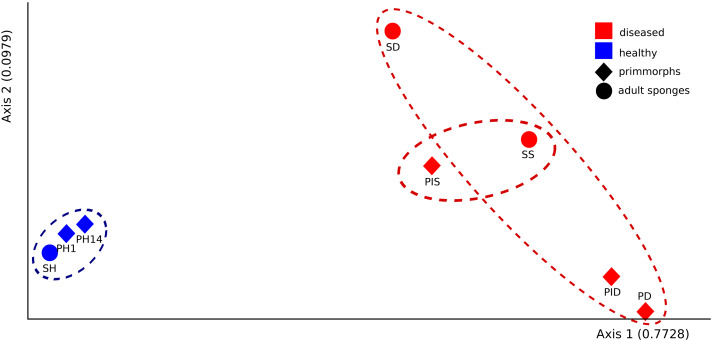
Figure 7. The beta-diversity results of PCoA indicating the data distribution between groups.
Samples of the healthy sponge and primmorphs are grouped into one cluster and differ significantly from the group of the diseased ones. Samples were referred to Table 1.

