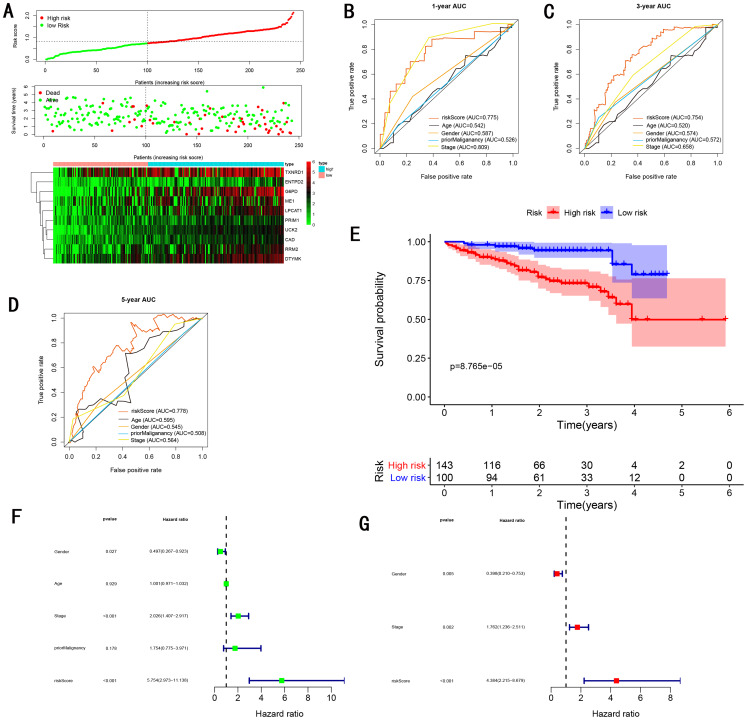
Figure 5. Gene signature performance analysis using ICGC testing cohort.
(A) Distribution of 10‐gene‐based risk scores, patient survival durations, gene expression levels. (B) One-year ROC curve analyses of gene signature and clinical parameters. (C) Three-year ROC curve analyses of gene signature and clinical parameters. (D) Five-year ROC curve analyses of gene signature and clinical parameters. (E) Kaplan–Meier curves of OS based on gene signature. (F) Prognostic value detection of the gene signature via univariate survival-related analysis. (G) Prognostic value detection of the gene signature via multivariate survival-related analysis.

