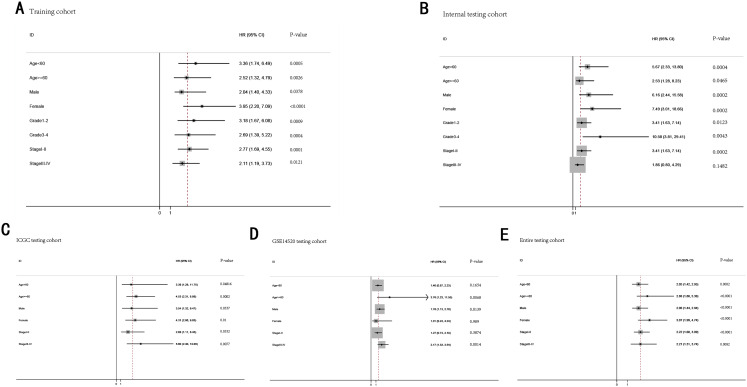
Figure 9. The predictive performance of the gene signature on OS in different subgroups stratified by clinical parameters.
(A) Training cohort. (B) Internal testing cohort. (C) ICGC testing cohort. (D) GSE14520 testing cohort. (E) Entire testing cohort.

