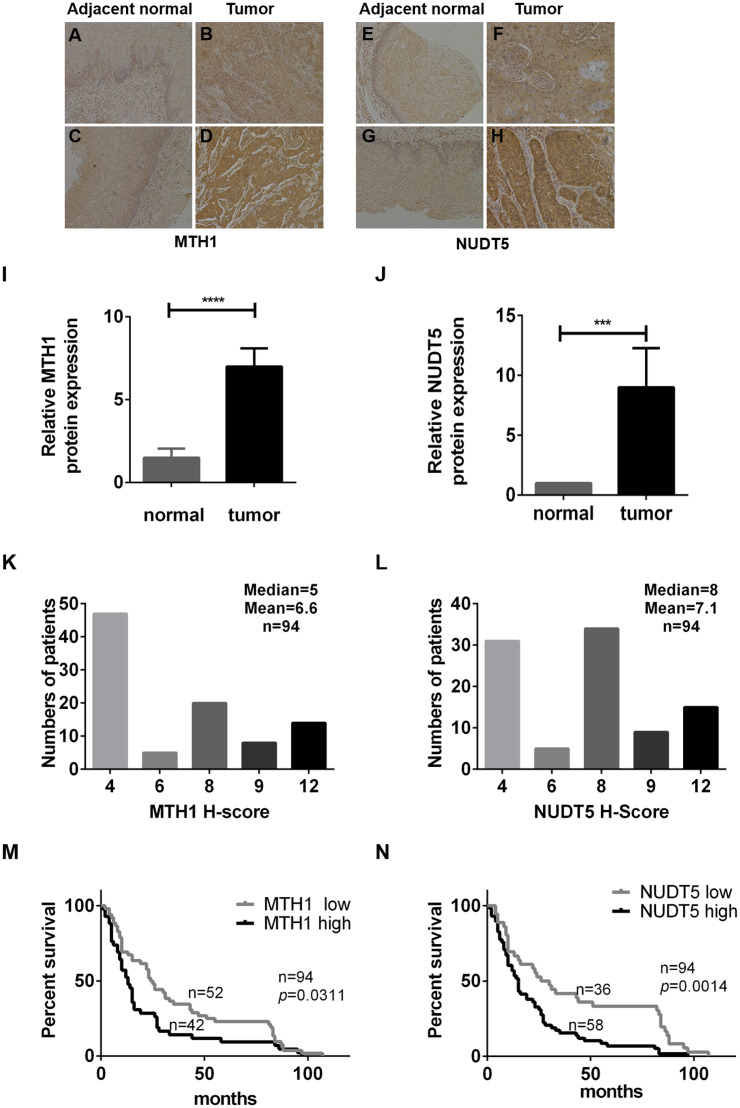
Figure 1. The expression of MTH1 and NUDT5 protein in ESCC tissues and Kaplan–Meier curves for the overall survival rate of ESCC patients.
(A–N) The expression of MTH1 and NUDT5 protein in ESCC tissues was assessed by immunohistochemistry with anti-MTH1 or anti-NUDT5 antibodies. Representative immunohistochemical staining for the MTH1 and NUDT5 expression in ESCC specimens (X100) are shown in A–H. (A) Very low expression of MTH1 in adjacent normal tissue. (B) Low expression of MTH1 in tumor tissue. Tissues of (A) and (B) come from the same patient. (C) Very low expression of MTH1 in adjacent normal tissue. (D) High expression of MTH1 in tumor tissue. Tissues of (C) and (D) come from the same patient. (E) Very low NUDT5 expression in adjacent normal tissues. (F) Low expression of NUDT5 in tumor tissue. Tissues of (E) and (F) come from the same patient. (G) Very low NUDT5 expression in adjacent normal tissue. (H) High expression of NUDT5 in tumor tissue. Tissues of (G) and (H) come from the same patient. (I) IHC score of MTH1 protein expression in adjacent normal tissue and tumor tissue of (A–D). (J) IHC score of NUDT5 protein expression in adjacent normal tissue and tumor tissue of (E–H) (Student’s t-test, *p < 0.05, compared with adjacent normal tissue). (K and L) Immunohistochemistry staining score distribution in ESCC patients. (M and N) Kaplan–Meier curves for the overall survival rate of ESCC patients. The association of the MTH1 and NUDT5 expression with the OS rate of ESCC patients was evaluated by a Kaplan–Meier survival analysis of immunohistochemical staining of TMAs. ESCC patients exhibiting a high expression of MTH1 and NUDT5 showed a lower survival than those with low levels (p = 0.0311 and p = 0.0014). p values were calculated by the log-rank test.

