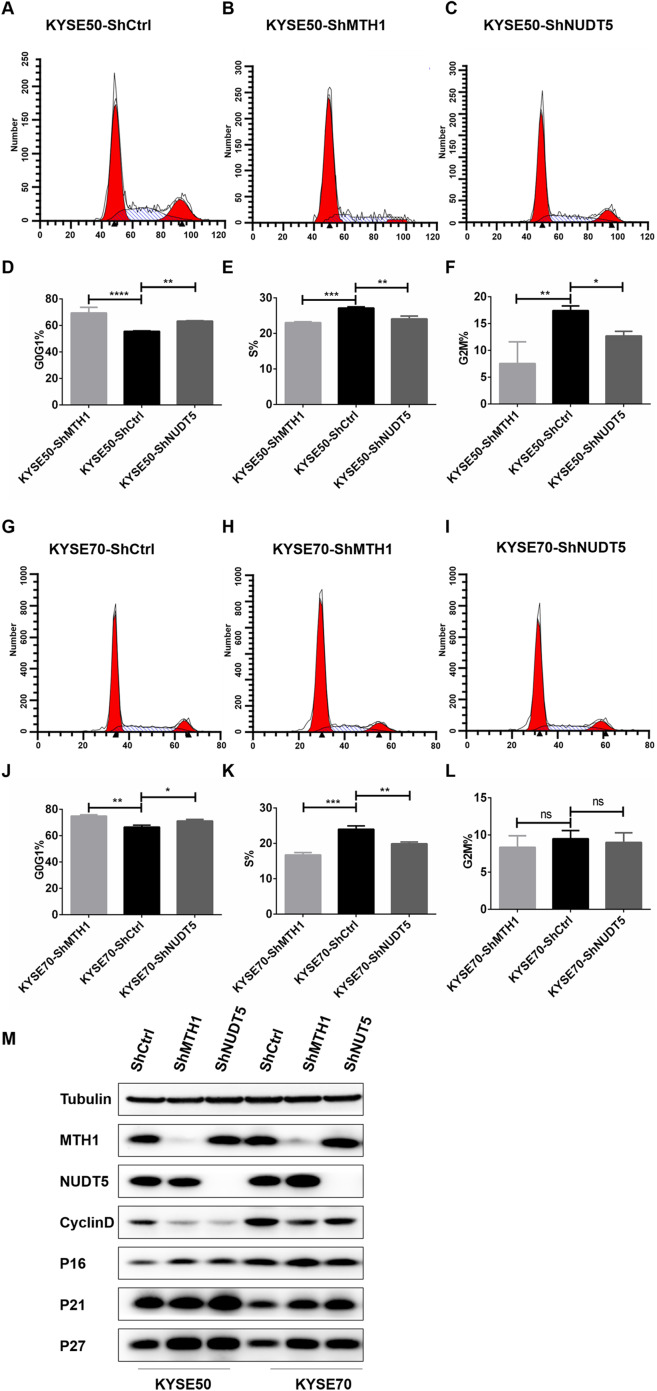
Figure 3. Blocking the expression of MTH1 and NUDT5 induced cell cycle arrest and affected the expression of cycle-related proteins in the KYSE50 and KYSE70 cell lines.
(A–F) The distribution of the cell cycle (G0/G1, S, G2/M) in the KYSE50 cell line was detected by flow cytometry. The difference between groups in the KYSE50 cell line was analyzed using a two-tailed Student’s t-test. *p < 0.05 and **p < 0.01. Data were expressed as the means ± standard deviation (*p < 0.05, **p < 0.01, ***p < 0.001). (G–L) The distribution of the cell cycle (G0/G1, S, G2/M) was detected by flow-cytometry in the KYSE70 cell line. The difference between groups in the KYSE70 cell line was analyzed using a two-tailed Student’s t-test. *p < 0.05 and **p < 0.01. Data are expressed as the means ± standard deviation (*p < 0.05, **p < 0.01, ***p < 0.001). (M) Levels of cyclin D, p16, p21 and p27 were detected by Western blotting with tubulin as a control. All the experiments were repeated three times.

