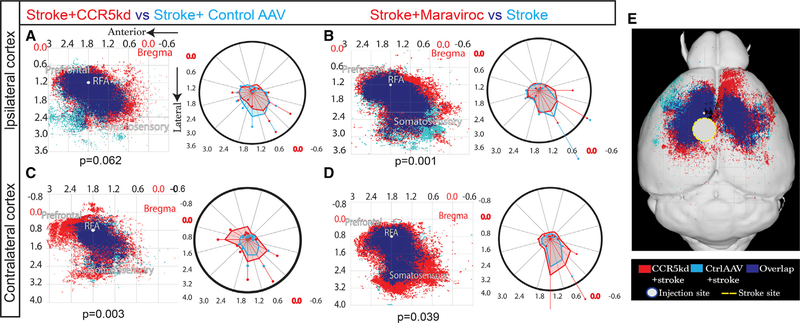
Figure 5. CCR5 kd Induces Axonal Sprouting in Contralateral Cortex.
Maps represent Cartesian coordinates of BDA-labeled axons. Axes represent approximate stereotactic coordinates lateral and anterior to bregma. BDA injection placed in pre-motor cortex 10 weeks post stroke. BDA+ve projections from injection site mapped in ipsilateral (A and B) and contralateral (C and D) cortices. Blue represents projections from control condition, red from treated conditions, and royal blue from overlap between conditions. Polar plots on the right of each map aid in visualizing spatial differences between conditions plotted. n = 5 animals per group; Hoteling’s T2 test. Additional data presented in Figures S3 and S4. (A and B) BDA-labeled projections mapped in ipsilateral cortex. A large proportion of axons overlaps between stroke + shCCR5 AAV (red) and stroke + control AAV (sky blue) (A). Treatment from either condition did not produce unique projections; p = 0.062. Statistical non-significance confirmed with additional testing that showed that 95% prediction ellipses under bivariate normal distribution have 93.5% overlap, suggesting spatial distribution of axons did not differ in a statistically meaningful way. Treatment with maraviroc (B, red) resulted in a band of unique projections that occupied peri-infarct cortex compared with stroke + vehicle (sky blue; p = 0.001).
(C and D) Cortical axons projecting from ipsilateral pre-motor cortex mapped in contralateral cortex.
(E) Overview of (A) and (C) in mouse brain showing extent of axonal projections in contralateral hemisphere as a result of CCR5 kd.

