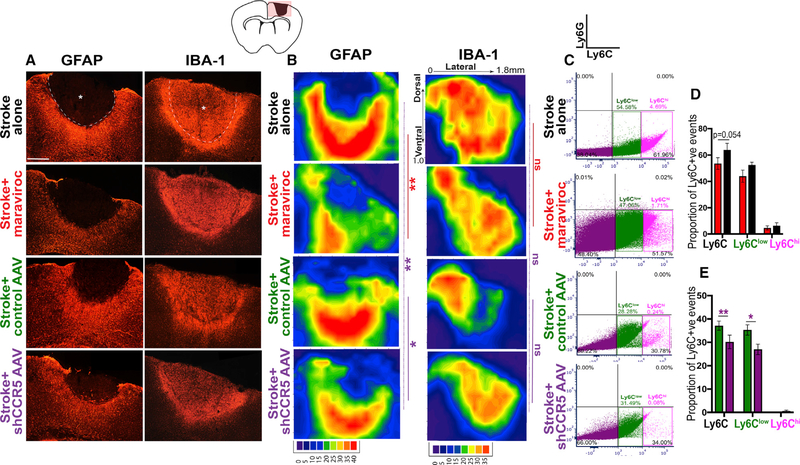
Figure 6.
CCR5 kd Reduces Astrocyte Reactivity and Dampens Post-stroke Macrophage Recruitment
(A) Images represent differential immunoreactivity for astrocytic marker GFAP and macrophage or microglial marker IBA-1 in different treatment conditions at 7 days after stroke. Astrocytic reactivity is notably reduced in animals with maraviroc or shCCR5 AAV treatment. Dotted line denotes infarct border; asterisk denotes infarct. Scale bar, 250 μm.
(B) Filled contour plots show pixel intensity heatmap for quantification of changes in spatial reactivity across infarct to peri-infarct zones. Axes represent distance from midline in the medial-lateral (x axis) and dorsal-ventral (y axis) positions. See also data for overall pixel intensity in Figure S6. n = 5 stroke + shCCR5 AAV, stroke + maraviroc and n = 4 stroke alone, stroke + control AAV.
(C–E) CCR5 kd dampens macrophage recruitment. Representative dot plots from FACS analysis show events gated for Ly6G (neutrophils; upper-right quadrant), Ly6Clow (macrophages; lower-right quadrant), and Ly6Chigh (reactive monocytes) from animals treated with stroke + control AAV or stroke + CCR5 AAV at 7 days post stroke quantified in (D) and stroke + maraviroc or stroke alone at 1 month post stroke quantified in (E); n = 4 stroke + control AAV and n = 5 for all other groups. Data are mean ± SEM.

