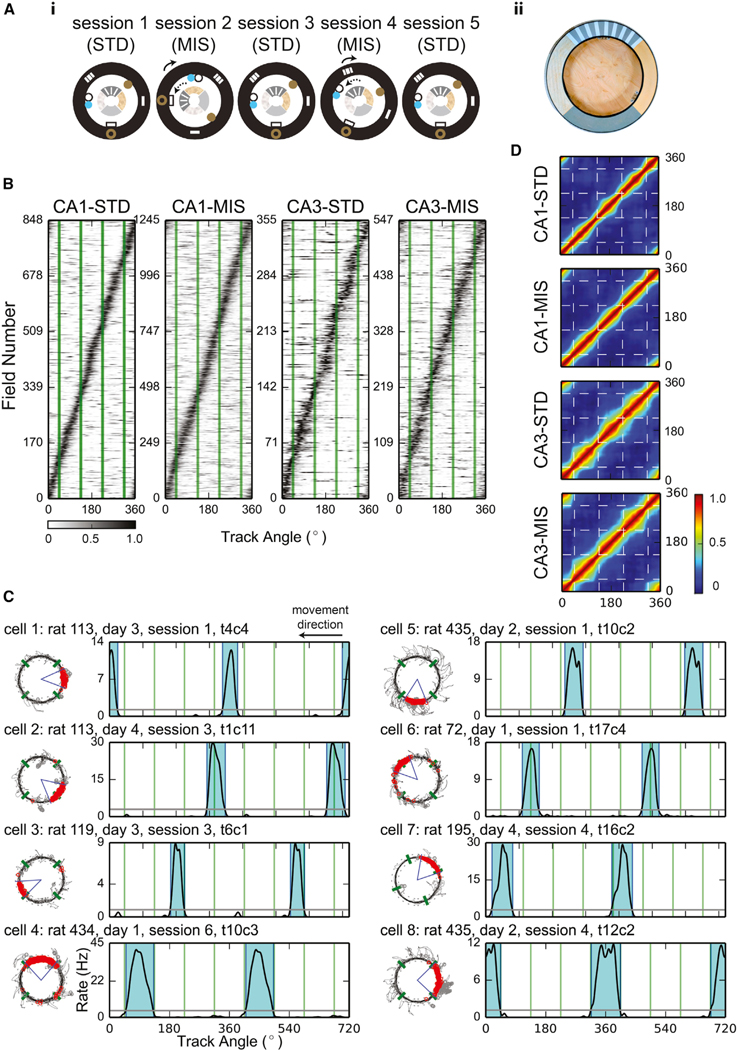
Figure 1. Local-Cue Boundaries Modulated the Locations of Place Field Edges.
(A) (i) Top-down schematics of the double-rotation experiment sessions. Local textures on the circular track are denoted by the different patterns of the inner ring. Global cues are denoted by shapes on the black outer ring representing the black curtains surrounding the track. The rotation directions of the local and global cues in the mismatch (MIS) sessions are indicated by the dotted and solid lines, respectively. In this example, 180° (session 2) and 45° (session 4) MIS sessions were interleaved with 3 standard (STD) sessions. (ii) Photograph of the textured, double-rotation track.
(B) Sorted firing-rate maps of all the place fields included in the analyses. The abscissa of the map is the track angle, and each row of the map is the firing-rate map of a unit. The locations of the local-cue boundaries are denoted by the green lines. The rate maps were normalized by the peak firing rates of each unit and were sorted by the centers of mass of the fields. About 20%–30% of the place cells had multiple place fields (CA1-STD: 171 out of 669 [26%] place cells with multiple place fields; CA1-MIS: 283 out of 890 [32%]; CA3-STD: 55 out of 293 [19%]; CA3-MIS: 95 out of 429 [22%]). For these cells, the same rate maps were included in the figure multiple times, with each subfield aligned by its center of mass. Gray-scale bar indicates normalized firing rate.
(C) Examples of place fields observed in CA1 (cells 1–4) and CA3 (cells 5–8). Some fields confined within a texture quadrant (cells 1 and 5) or crossing a local-cue boundary (cells 2 and 6) had no edges close to any of the local-cue boundaries. Other fields had one edge near a boundary (cells 3 and 7) or had both of their edges near the boundaries (cells 4 and 8). Fields that had one or more edges near a boundary could be contained within a single texture quadrant or could span across multiple quadrants. For each cell, the trajectory-spike plot (left) and the linearized firing-rate map (right) are presented. The blue-shaded areas represent the ranges of the place fields, and all rate maps are duplicated and concatenated in order to show fields crossing 0°. The local-cue boundaries are labeled by green lines in both plots.
(D) The cross-correlograms of the PVs. The narrow pinch points of the diagonal band near the local cue-boundaries (dashed lines) show that the PVs changed more rapidly across the boundaries than across similar distances within a texture quadrant. The firing-rate maps were normalized by the peak firing rates before constructing the cross-correlograms. Color bar indicates the correlation coefficients.
See also Figures S1 and S7.

