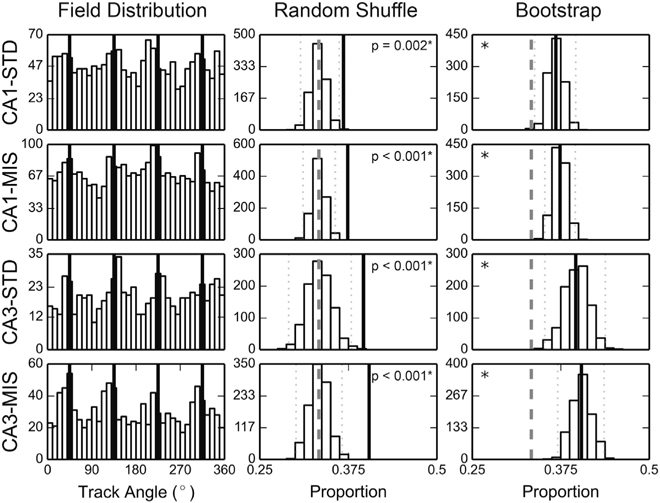
Figure 2. Place Field Edges Coincided with Local-Cue Boundaries.
Left: the distributions of place field edges peaked near the local-cue boundaries (denoted by the black lines). The abscissa of the map is the track angle and the ordinate is the number of field edges observed within the corresponding spatial bin. Middle, right: the random shuffling control distributions (middle column) and the bootstrapped distributions (right column) of the proportion of field edges observed within the local-cue windows. The experimentally observed values are denoted by the thick black lines, the 95% confidence intervals of the simulated distributions by the dotted lines, and the chance level (0.33) by the dashed lines. *significant at α = 0.05, Bonferroni corrected for 4 comparisons.
See also Figures S2, S3, and S4A.

